If you're in the business of value-add real estate, you live and die by one number: the After Repair Value (ARV). Getting this number right is the difference between a profitable deal and one that drains your bank account. Using an after repair value calculator is the quickest way to nail down your ARV and make confident investment decisions.
This guide provides a step-by-step framework for calculating ARV, whether you're a first-time flipper or a seasoned pro. We'll cover finding comps, estimating repairs, and using a calculator to analyze deals faster and with more accuracy.
Why After Repair Value Is Your Most Important Number
Whether you’re a seasoned pro juggling multiple deals or just getting started, the ARV is the anchor for your entire project. It's the financial compass that guides every single decision, from your offer price to your renovation scope and, ultimately, your profit.
Think of it this way: the purchase price is what you pay, and the rehab cost is what you spend. But the ARV is what you earn. It’s the market’s stamp of approval on your finished product. Without a solid ARV, you’re just throwing money at a property and hoping for the best.
For Beginners and Experienced Investors
If you're new to strategies like fix-and-flips or BRRRR (Buy, Rehab, Rent, Refinance, Repeat), a solid ARV calculation is your foundation. It gives you a clear target and helps you figure out which renovations actually create value versus which are just money pits. A good ARV keeps you from gold-plating a bathroom in a neighborhood that can't support the cost.
For veteran investors, a precise ARV is a competitive weapon. It lets you:
- Move faster on good deals. When you trust your numbers, you can make confident offers while others are still analyzing.
- Unlock better financing. Lenders, especially hard money lenders, often base loan amounts on a percentage of the ARV, not just the purchase price. A well-defended ARV can mean more funding and less cash out-of-pocket.
- Negotiate from a place of power. Walking into a negotiation with a data-backed ARV gives you leverage with sellers, partners, and even contractors.
An ARV is a forward-looking estimate of what a property will be worth. This is different from a standard appraisal, which assesses its current, 'as-is' condition. For investors, that distinction is crucial—you're being valued on the future you create.
How an Investor Marketplace Helps with ARV Analysis
On a real estate investing platform, running these numbers fast is paramount. When you spot a potential deal on our marketplace, you can use the built-in analysis tools to model the ARV in seconds. Instead of juggling spreadsheets, you can plug in your estimated repair costs right on the listing and see if the deal meets your criteria.
This immediate feedback loop is essential for sifting through opportunities efficiently. It’s also a huge benefit for wholesalers—when they post deals with a realistic, data-backed ARV, they look far more credible to serious buyers on the platform.
Step 1: Find and Vet High-Quality Comps
An after repair value calculator is only as credible as the data you feed it. That data comes from comparable sales—or "comps," as you'll hear them called—which are recently sold properties that resemble what your target property will look like after you’ve completed the renovations.
Finding and properly vetting these comps is the single most critical step. Get this wrong, and your entire financial model is built on a shaky foundation. Your goal isn't to find an exact twin of your house. You’re looking for properties a future buyer would see as functionally equivalent to yours once the renovations are done.
Where to Source Reliable Comps
Your most reliable source of data is the Multiple Listing Service (MLS). It has the most accurate and up-to-date sales information. If you’re not a licensed real estate agent, the best approach is to partner with an investor-friendly agent who can provide direct access.
Other sources can help you get started, but always cross-reference them:
- Public Records: County assessor websites have property details and sales history, but the data often lags and may not reflect the property’s actual condition.
- Large Real Estate Portals: Sites like Zillow and Redfin have "recently sold" filters that are great for initial research, but you must verify the details.
- Investor-Focused Platforms: On our marketplace, you can often see what similar properties have sold for, giving you a quick pulse on what other investors are valuing in a specific area.
For Beginners: Team up with a good real estate agent. Their MLS access and local knowledge are invaluable. Even if you're a seasoned pro, it's smart business to double-check your numbers against another source.
The Anatomy of a High-Quality Comp
Not every sold property is a good comp. A strong comparable sale must meet strict criteria based on three key pillars: Proximity, Recency, and Similarity. If one is off, the entire comparison becomes unreliable.
Key Takeaway: Using a bad comp is far worse than having no comp at all. Pulling outdated or mismatched properties into your analysis will poison your numbers and set you up for a financial mistake.
Here’s what you must look for in a solid comp:
- Proximity: The property should be as close as possible, ideally in the same subdivision or within a 1-mile radius. In a dense city, you might shrink that to a few blocks. In a rural area, you can stretch it, but with extreme caution.
- Recency: The sale needs to reflect what the market is doing right now. Aim for sales within the last 6 months. If the market is moving fast, tighten that window to 90 days or less.
- Similarity: This is where your judgment is crucial. The comp needs to mirror your subject property in several key ways.
Core Similarity Factors to Match
When lining up properties, focus on features that move the needle on value. You can adjust for small differences later, but if the core features are way off, the comp is useless. You can get a better sense of what to look for by learning how to find off-market properties that fit these profiles.
Here's your similarity checklist:
- Style and Age: Compare a ranch to another ranch, a colonial to a colonial. A 1920s bungalow isn't comparable to a 2005 tract home.
- Square Footage: The gross living area should be within 15-20% of your property’s size. A 1,200 sq. ft. home is not a good comp for a 2,500 sq. ft. one.
- Bed and Bath Count: Try to match this exactly. A 3-bed/2-bath home sells very differently from a 3/1 or a 4/2 in most markets.
- Lot Size and Features: Pay attention to yard size, garage spaces, and whether there's a basement or a pool. These are major decision-drivers for buyers.
- Condition: This is non-negotiable. You must compare your future renovated property to comps that were also sold in updated, move-in-ready condition. Look for listing photos showing new kitchens, modern baths, and fresh finishes.
Step 2: Make Adjustments to Your Comps
You’ve pulled your comps. Now comes the part where pros separate themselves from amateurs: making accurate adjustments. Simply finding a list of similar houses isn't enough. The skill lies in accounting for the differences by assigning a real dollar value to what makes them different.
This step turns a fuzzy list of "similar" homes into a sharp set of truly "comparable" data points. The logic is simple:
- If a comp is superior to your finished property (e.g., it has an extra bathroom), you subtract value from its sale price.
- If a comp is inferior to your finished property (e.g., it has a one-car garage and you’re building a two-car), you add value to its sale price.
Valuing Key Feature Differences
How much is a feature actually worth? The answer is always, "It depends on the market." A two-car garage might be a $20,000 must-have in a suburb but almost worthless in a dense city. Your best source for these numbers is an investor-friendly real estate agent or a local appraiser.
Here are the most common features you’ll adjust for:
- Gross Living Area (GLA): This is the most frequent adjustment. You can calculate the price per square foot of your comps and apply it to the size difference, but be careful. The value of an extra 100 sq. ft. is more impactful on a 1,200 sq. ft. house than on a 3,500 sq. ft. home.
- Bathrooms: A full bath is almost always worth more than a half bath. The jump from one to two bathrooms often brings the biggest value bump.
- Bedrooms: Adding a bedroom can be a huge value-add, but only if it feels right for the house's size.
- Garage & Parking: The value varies wildly by location and climate. The difference between a one-car and a two-car garage is a critical adjustment.
- Basements: The value hinges on whether it's finished or unfinished. Finished basement square footage is never valued the same as above-ground space. A common rule is to value it at 50-70% of the main floor's price per square foot.
For Beginners: Don't get paralyzed trying to find the "perfect" number. Ask an experienced local agent for their ballpark adjustment sheet. They'll often have a standard range for things like a full bath ($10,000-$15,000) or a garage space ($5,000-$10,000) that works for your specific area.
Before you start tweaking dollar values, ensure your initial comps are solid. This initial vetting process is non-negotiable.
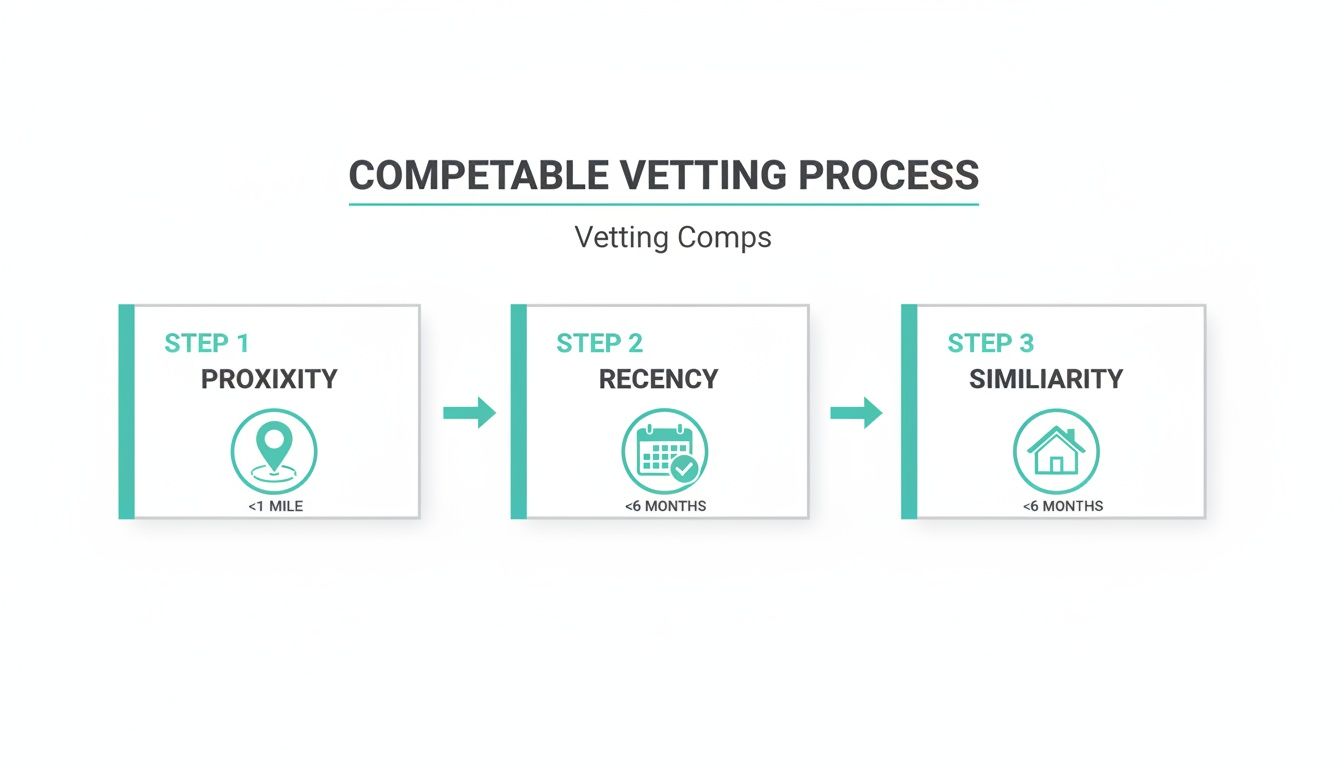
Following this flow ensures your starting comps are relevant, making the next phase of adjustments more accurate and saving you from speculative guesses.
Sample Comp Adjustment Values for Illustration
This table provides a guide for typical adjustments. Remember to verify these values with local data.
| Feature Difference | Typical Adjustment Range | Investor Considerations |
|---|---|---|
| Full Bathroom | $10,000 – $25,000 | The jump from 1 to 2 baths is most valuable. A 5th or 6th bath has diminishing returns. |
| Half Bathroom | $5,000 – $10,000 | Very valuable in homes with only one full bath or a poor layout. |
| Garage Space | $7,500 – $15,000 per car | Varies dramatically with climate and urban density. |
| GLA (per sq. ft.) | $50 – $150+ | Not linear. Value per sq. ft. decreases as the home gets larger. |
| Finished Basement | 30% – 70% of above-grade PSF | Depends on finish quality, ceiling height, and walk-out access. |
| Central Air (vs. none) | $5,000 – $12,000 | A must-have in hot climates; less critical in temperate zones. |
| Fireplace | $2,000 – $5,000 | A nice-to-have, but rarely a deal-breaker for buyers. |
These figures are a starting point. Always get local confirmation, as a pool in Miami is worth a lot more than a pool in Minneapolis.
Putting It All Together: An Adjustment Example
Let's walk through a simplified adjustment scenario. Your subject property, post-renovation, will be a 3-bed, 2-bath, 1,500 sq. ft. house with a 2-car garage.
You found a great comp that sold recently for $425,000.
- It's a 3-bed, 2.5-bath, 1,500 sq. ft. house with a 1-car garage.
Here's how you’d adjust its sale price:
Adjust for the Bathroom: The comp is superior (extra half-bath). In this market, a half-bath is worth $8,000. You subtract that from the comp's price.
- $425,000 - $8,000 = $417,000
Adjust for the Garage: The comp is inferior (only a 1-car garage). That extra bay adds value. If an extra garage space is worth $12,000, you add that to the comp's price.
- $417,000 + $12,000 = $429,000
The Adjusted Value of this single comp is $429,000. Repeat this process for at least two other high-quality comps. The average of your adjusted values gives you a defensible ARV. An after repair value calculator can automate the math, but the quality of your inputs dictates the reliability of the output.
Step 3: Estimate Your Renovation Costs Like a Pro
Your ARV tells you what a property could be worth. Your renovation budget determines if you'll actually make money getting it there. Underestimating repair costs is the fastest way to kill a deal's profitability. A solid rehab budget is your single most important tool for protecting your profit.
It all starts with a document that separates pros from amateurs: the Scope of Work (SOW). This is your project’s bible. A detailed SOW breaks down every task, from demolition to the specific faucet model you plan to install. A vague budget is a recipe for disaster; a detailed SOW is your shield against blown budgets.
Nail Down Your Scope of Work and Budget
To build a real SOW, walk the property and document everything that needs to be repaired or replaced. "Update kitchen" is not an SOW line item. "Install 15 linear feet of white shaker cabinets, Calacatta quartz countertops, and a Samsung stainless steel appliance package" is. That level of detail is non-negotiable.
Once your SOW is locked in, build a budget that accounts for everything:
- Materials: Get real-world pricing for your specific flooring, fixtures, and paint.
- Labor: This is usually your biggest line item. Get multiple quotes.
- Permits and Fees: Never forget the city. Permit costs can add thousands to a project.
- "Other" Costs: This includes dumpsters, portable toilets, and debris removal.
Crucial Insight: Your budget is useless without a contingency fund of 15-20% of your total estimated cost. This isn’t "extra" money. It's for the inevitable surprises you'll find when you open up a wall. It’s not a matter of if you’ll find surprises, but when.
How to Budget Based on Your Experience Level
Your approach to budgeting will evolve as you gain experience.
For Beginner Investors: Your main job is to avoid making expensive assumptions. Never guess what a repair will cost.
- Get Multiple Bids: Walk at least three qualified contractors through the property with the exact same SOW to compare apples to apples.
- Use Cost Averages Carefully: Use local cost-per-square-foot data for big jobs like roofing or flooring as a gut check.
- Lean on Your Team: Smart financing is part of the budget. Learn how loan products like hard money construction loans work to see if that strategy fits your project.
For Experienced Investors: After a few projects, you can build your own cost database to make estimates faster.
- Track Every Dollar: After each project, log the final, real cost for every line item. You should know your cost per window, cost per linear foot of baseboard, etc.
- Build Your "A-Team" of Contractors: Use your deal flow to negotiate better pricing with your go-to contractors.
- Systemize Your SOW: Create a master SOW template that you can copy and customize. This makes the process faster and ensures you never forget a line item.
Whether you're using an after repair value calculator or a legal pad, your profit projection is only as good as your repair estimate. A disciplined approach to budgeting is what turns a promising ARV into actual cash.
Step 4: Use an ARV Calculator to Analyze Deals Faster
You’ve done the legwork: you’ve pulled comps, made adjustments, and hammered out a repair budget. Now you just have to put it all together to land on that final number.
Sure, you can do this with a spreadsheet. After you’ve adjusted at least three good comps, you just find their average.
- Adjusted Comp 1: $429,000
- Adjusted Comp 2: $435,000
- Adjusted Comp 3: $422,000
The math is simple: ($429,000 + $435,000 + $422,000) / 3 gives you a solid ARV of $428,667. But doing it manually takes time you might not have when a great deal drops. This is where an after repair value calculator becomes a competitive edge, letting you analyze deals with speed.
How a Digital ARV Calculator Works
Instead of fumbling with a spreadsheet, a built-in tool gives you a clean interface to plug in your numbers and see the results instantly. This streamlines everything, making you faster and less likely to make a costly typo. When you need to make an offer before anyone else, that speed is your best friend.
Here’s what a typical ARV calculator looks like on an investor platform.
You just punch in the purchase price, your total repair estimate, and the adjusted values for your comps. The tool immediately spits out the ARV, potential profit, and other key metrics.
This immediate feedback lets you run different scenarios in seconds. What if repairs cost 15% more? What if the market dips by 5%? An after repair value calculator lets you stress-test the deal on the fly, so you can move forward with confidence.
For Experienced Investors: This is how you build speed into your underwriting system. You can burn through dozens of potential deals, filtering out the duds and spending your time only on the ones that have a real shot.
From Calculation to Actionable Insight
The real power of an integrated after repair value calculator isn’t just doing math faster; it’s about what you can do next. When these tools are built into property listings on a platform, your entire process gets an upgrade.
- Analyze Deals Instantly: A wholesaler posts a new deal on the platform, and you can plug your numbers in right on the listing to see if it fits your criteria.
- Compare Opportunities: See five potential flips in your target zip code? Run ARV calculations for all of them in minutes and rank them by profit potential.
- Make Data-Driven Offers: When you’re ready to submit an offer, your analysis is already there. You can pull the trigger with confidence, knowing your offer is backed by numbers, not just a gut feeling.
- Enhance Credibility: For wholesalers, this is huge. Presenting a deal with a clear, calculator-generated analysis sheet shows buyers you’ve done your homework. It builds trust and helps them instantly see the value.
This seamless flow between finding deals and analyzing them separates the pros from the pack. By leaning on a solid after repair value calculator, you spend less time crunching numbers and more time closing deals.
Got ARV Questions? We've Got Answers
Even with the right formula and a good calculator, calculating After Repair Value can bring up nagging questions. Getting straight, practical answers is key to building confidence in your numbers. Let's clear up the most common sticking points.
How Is ARV Different From a Standard Appraisal?
This is a critical distinction. A standard appraisal looks backward. It’s an assessment of a property's value in its current, "as-is" condition. A lender orders this to make sure the property is enough collateral for the loan.
An ARV, on the other hand, looks forward. It’s an investor's projection of what the property will be worth after all planned renovations are finished. It’s an estimate of the future value you’re working to create. Your ARV is for your profit; their appraisal is for their risk.
What Is the 70% Rule and How Does It Use ARV?
You'll hear the "70% Rule" thrown around in house-flipping circles. It’s a quick guideline investors use to figure out their Maximum Allowable Offer (MAO) on a potential flip. It's not a law, but it’s a useful filter for weeding out bad deals fast.
The formula is simple: MAO = (ARV x 0.70) – Estimated Repair Costs
That 30% gap isn't pure profit. It’s a buffer designed to cover all your other expenses:
- Holding costs (taxes, insurance, utilities)
- Financing costs (loan points and interest)
- Selling costs (realtor commissions, closing costs)
- Your desired profit
The 70% Rule is only as good as the numbers you feed it. A garbage ARV gives you a garbage MAO. In hyper-competitive markets, many investors push that to 75% or even 80%, while in slower markets, a more conservative 65% might be necessary to protect margins.
Can I Rely Solely on an Online After Repair Value Calculator?
An online after repair value calculator is a powerful tool, but it's not a crystal ball. It’s a machine designed to process the numbers you feed it. The quality of its output is 100% dependent on the quality of your input.
The best practice is to use a calculator to structure your analysis and run scenarios quickly, but never skip your own due diligence. Technology speeds up the process; it doesn't replace your judgment.
Successful investors blend technology with boots-on-the-ground validation. Use a calculator for a fast, initial read, but before you write an offer, you must:
- Personally vet every single comp.
- Get real-world repair estimates from trusted contractors.
- Apply your own knowledge of the neighborhood and market trends.
The calculator gets you 80% of the way there in a fraction of the time. Your expertise gets you the rest of the way.
How Do Market Shifts Affect My ARV Calculation?
The market is the one massive variable that can make or break your project. The time between when you buy a property and when you sell it—your holding period—is when you are most exposed to market risk.
In a rising market, your final sale price might end up higher than your initial ARV. This is a great problem to have. But in a falling market, your sale price could be significantly lower, wiping out your profit.
Here’s how smart investors manage this risk:
- Use the most recent comps possible. In a fast-moving market, a sale from six months ago is ancient history. Look at comps that closed less than 90 days ago.
- Build a healthy contingency. That 15-20% you add to your rehab budget is also a cushion against a slight market dip.
- Adjust your profit expectations. In a declining market, experienced flippers might aim for a higher profit margin to create an extra buffer. For BRRRR investors, understanding how ARV impacts rental yields is crucial. Check out our guide on how to calculate cap rate for more on this relationship.
- Speed is your best friend. The faster you can finish the rehab and list the property, the less time you’re exposed to market swings.
Ultimately, a strong ARV calculation is about reducing uncertainty. By mastering this number, you stop speculating and start making calculated, data-driven investment decisions.
Ready to stop juggling spreadsheets and start analyzing deals faster? Investor Deal Exchange provides a marketplace of deals with built-in analysis tools, including an ARV calculator.
Create your free investor profile to get matched with deals that fit your criteria.