
A property investment return calculator is the tool that separates professional investors from amateurs. It’s what turns an emotional hunch about a "good deal" into a cold, hard, data-driven decision, helping you avoid costly mistakes by revealing a property's true profit potential before you invest.
You feed it the numbers—purchase price, financing, rent projections, and operating expenses—and it calculates the key metrics that matter, like cash flow, cap rate, and cash-on-cash return. It gives you a clear financial snapshot before you put any money on the line, forming the foundation of a scalable investment strategy.
Stop Guessing and Start Analyzing Your Deals
Relying on a gut feeling to buy real estate is one of the fastest ways to lose money. A good property investment return calculator is your first line of defense, providing a standardized system to underwrite any deal that comes your way.
This is how you objectively compare an Atlanta single-family rental against a Dallas duplex. By using the same financial yardstick, you strip away the emotion and bias that can cloud your judgment.
- For beginners: This is about building a repeatable system you can trust for every deal.
- For experienced investors: It's about speed and scale—sifting through dozens of listings to find the one that truly moves the needle for your portfolio.
Why Data-Driven Decisions Matter
Investing in real estate isn't just about buying a building; it's about acquiring a financial asset. The numbers have to work. And when they do, the results are powerful.
For example, analysis of leveraged single-family rentals in the U.S. shows how well a smart investment can perform. Over the 20 years leading up to 2023, these properties delivered an average annual return of 11.7% when factoring in both appreciation and rental income. That includes a compound annual growth rate (CAGR) on property values of 6.49% per year nationally. Consistent analysis is what uncovers these opportunities.

A calculator forces you to look beyond curb appeal and confront the numbers that determine success or failure. It's the bridge between a property you like and an investment that performs.
This guide will walk you through the core metrics a solid property investment calculator uses to paint the full financial picture of any deal.
Key Metrics Your Calculator Will Uncover
To analyze a deal like a pro, you need to speak the language of returns. These essential metrics, when used together, provide a 360-degree view of a property's potential. They aren't just jargon; they're the vital signs of your investment.
The table below breaks down the must-know terms.
| Metric | What It Measures | Why It Matters for Investors |
|---|---|---|
| Net Operating Income (NOI) | The property's total income minus all operating expenses (but before the mortgage). | It shows if the property itself is profitable, separate from your financing. It's the purest measure of an asset's performance. |
| Capitalization Rate (Cap Rate) | The property's NOI divided by its current market value. It's the unleveraged rate of return. | This is your go-to metric for comparing the relative value of different properties in the same market, apples to apples. |
| Cash-on-Cash Return | The annual pre-tax cash flow divided by the total cash you actually invested out-of-pocket. | This is the big one for leveraged investors. It answers the most important question: "How hard is my cash actually working for me?" |
Getting a handle on these three metrics is the first step toward making confident, informed decisions. Mastering them will completely change how you look at deals.
On a real estate marketplace, these calculations are often built right into property listings, making deep analysis incredibly fast. You can see them in action by checking out our suite of built-in real estate investment calculators.
Gathering the Right Inputs for Accurate Analysis
Any property investment return calculator is only as good as the numbers you feed it. Garbage in, garbage out. A professional analysis requires digging into the nitty-gritty details that truly define a deal's profitability, not just plugging in the asking price and a dream rent number.
Getting this part right is what separates a hopeful amateur from a serious investor. The goal is to build a financial model based on reality, not optimism. That means sourcing reliable data for every line item, from income down to the smallest expense.
Sourcing Your Income and Expense Data
Your first task is to build a realistic picture of the property's financial life. This takes some detective work, but it’s a non-negotiable step if you want your calculations to mean anything.
- For beginners: Start with public records and local experts. You can find property tax history on the county assessor's website. For an insurance quote, call a local agent who works with investors. To get rental comps, talk to a property manager in the area—they know the real market rents and typical vacancy rates.
- For experienced investors: Stress-test the seller's numbers. Is their claimed $2,000/month rent achievable today, or was that a peak-market figure? Verify everything and build a conservative model that accounts for future capital expenditures (CapEx)—the big-ticket items like a new roof or HVAC system.
Here are the critical inputs you need to gather:
- Reliable Rental Comps: Look at what similar properties are actually renting for right now. Zillow and Rentometer are decent starting points, but calling local property managers provides the best ground truth.
- Property Tax Records: Never use the seller's current tax bill. A sale almost always triggers a reassessment, so check the county assessor's site for the tax rate and calculate it based on your purchase price.
- Insurance Quotes: Get a real quote from an insurance broker for a landlord policy. A property in a flood zone or high-risk area can have surprisingly high premiums that kill a deal's cash flow.
Accounting for Realistic Operating Expenses
This is where many new investors get into trouble. They dramatically underestimate the true cost of operating a rental property, leading to disappointing returns. A proper analysis requires honest, conservative expense projections.
A common rule of thumb for beginners is the 1% Rule, which suggests annual maintenance will cost about 1% of the property's value. For a $300,000 house, you'd budget $3,000 per year ($250/month). While a decent starting point, a brand-new home will likely need less maintenance than a 50-year-old property, even if they have the same value.
A more sophisticated approach is to budget for expenses as a percentage of gross rental income. This method scales with the property's earning potential and forces a more disciplined analysis.
Here's a breakdown of the expenses you need to budget for:
- Vacancy: No property stays occupied 100% of the time. A conservative vacancy rate is typically between 5% and 8% of the gross annual rent. It's always wise to plan for downtime between tenants.
- Repairs & Maintenance: This covers the small stuff—a leaky faucet, a broken doorknob, a running toilet. Budgeting 5-8% of gross rent is a common and safe practice.
- Capital Expenditures (CapEx): This is for major replacements like an HVAC system or roof. You must set aside another 5-10% of gross rent into a separate account. You will be glad you did when an $8,000 bill for a new roof comes due.
- Property Management: Even if you plan to self-manage, include this fee (8-10% of gross rent) in your calculations. This ensures the deal still works if you hire a manager later, and it also pays you for your own time.
Gathering this data can feel time-consuming, but this is the work that makes you money. On platforms like Investor Deal Exchange, many of these data points are pre-populated, and you can message the seller directly to ask questions, speeding up the entire underwriting process.
Calculating Your Four Core Return Metrics
Once you’ve gathered your inputs, your property investment return calculator can turn that raw data into intelligence that tells you whether a deal is a dud or a home run. We'll walk through the four essential metrics every investor, from rookie to seasoned pro, needs to master.
To keep it practical, we'll run the numbers on a sample deal: a $250,000 duplex you're buying with a 25% down payment. Each unit rents for $1,100 a month, for a Gross Scheduled Income (GSI) of $2,200 monthly or $26,400 annually.
This basic flow—from what you pay, to what you collect in rent, to what you spend on costs—is the bedrock of every deal analysis.
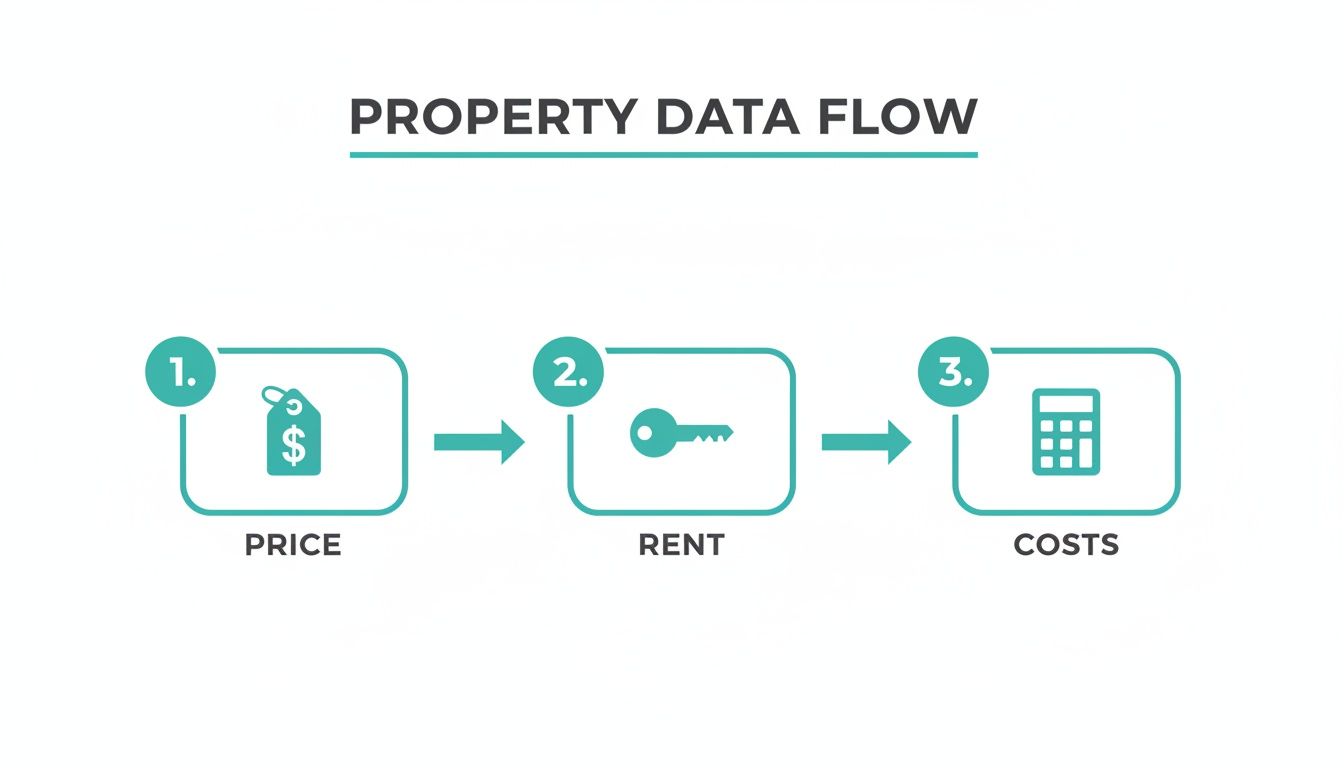
As the diagram shows, these three pillars—price, rent, and costs—are what support every calculation we're about to make.
Net Operating Income (NOI): The Foundation Of Profitability
Before you think about your mortgage, you have to answer one simple question: does this property make money on its own? That’s exactly what Net Operating Income (NOI) tells you.
NOI is the property's gross income minus all its operating expenses. Critically, it leaves out loan payments (debt service) to measure the raw earning power of the asset itself, separate from how you financed it.
Formula: Gross Operating Income (GOI) - Total Operating Expenses = NOI
Let's use the numbers for our duplex:
- Gross Scheduled Income: $26,400
- Vacancy (5% buffer): -$1,320
- Gross Operating Income (GOI): $25,080
- Operating Expenses (taxes, insurance, repairs): -$9,240
- Net Operating Income (NOI): $15,840
That $15,840 is the pure profit the property generates each year before you pay the bank. It's the starting point for everything else.
Capitalization Rate (Cap Rate): Your Go-To For Market Comparison
The Capitalization Rate, or Cap Rate, is one of the most common metrics in real estate. It’s a quick way to measure an unleveraged return on investment.
It answers the question: "If I paid all cash for this property, what would my annual return be?" This is incredibly powerful for making direct, apples-to-apples comparisons between different deals, regardless of financing.
Formula: Net Operating Income (NOI) / Purchase Price = Cap Rate
For our duplex:
- NOI: $15,840
- Purchase Price: $250,000
- Calculation: $15,840 / $250,000 = 0.0633
- Cap Rate: 6.33%
A 6.33% cap rate is your baseline. Now you can compare it to other duplexes in the area to see if you're getting a good deal for the market. To dive deeper, check out our full guide on how to calculate cap rate and why it matters.
Cash-on-Cash Return: The True Measure Of Your Invested Capital
While cap rate is useful, most investors use leverage. Cash-on-Cash (CoC) Return is the metric that matters most to your bank account, telling you exactly how hard the money you actually invested is working for you.
CoC measures your annual pre-tax cash flow against the total cash you invested to complete the deal.
Formula: Annual Pre-Tax Cash Flow / Total Cash Invested = Cash-on-Cash Return
Back to our duplex:
- Down Payment (25%): $62,500
- Closing Costs (3%): $7,500
- Total Cash Invested: $70,000
- NOI: $15,840
- Annual Mortgage Payment: -$11,390 (for a $187,500 loan at 6.5%)
- Annual Pre-Tax Cash Flow: $4,450
- Calculation: $4,450 / $70,000 = 0.0635
- Cash-on-Cash Return: 6.35%
This number tells you that for every dollar you put in, you’re getting back about 6.4 cents in cash flow each year.
Total Return on Investment (ROI): Seeing The Complete Picture
Cash flow is king, but it's not the only way you build wealth in real estate. Total Return on Investment (ROI) provides the most complete view by adding in the other components: the equity built from paying down your loan and the property's appreciation.
While U.S. housing has historically appreciated around 4.2% a year, that number doesn't capture the power of leverage. A small price gain on the property can translate into a massive return on your initial down payment.
Formula: (Annual Cash Flow + Principal Paydown + Appreciation) / Total Cash Invested = ROI
For our duplex example in the first year:
- Cash Flow: $4,450
- Principal Paydown: $2,160
- Appreciation (assuming 4%): $10,000
- Total Return: $16,610
- Calculation: $16,610 / $70,000 = 0.237
- Total ROI (Year 1): 23.7%
Suddenly, that modest 6.35% cash-on-cash return looks much more powerful. This is how you see the full wealth-building potential of a deal.
Worked Example: $250k Duplex Analysis
Let's pull all four metrics together to see how they tell the story of our duplex deal.
| Metric | Formula | Example Calculation | Result |
|---|---|---|---|
| NOI | GOI - Operating Expenses | $25,080 - $9,240 | $15,840 |
| Cap Rate | NOI / Purchase Price | $15,840 / $250,000 | 6.33% |
| Cash-on-Cash | Annual Cash Flow / Cash Invested | $4,450 / $70,000 | 6.35% |
| Total ROI | Total Return / Cash Invested | $16,610 / $70,000 | 23.7% |
Each metric gives you a different piece of the puzzle. NOI measures the property's health, Cap Rate compares it to the market, Cash-on-Cash measures your pocketed return, and ROI shows the full wealth-building picture. Using them together leads to smart investment decisions.
Turning Numbers Into Smart Investment Decisions
Running the numbers through a property investment return calculator is only half the battle. The real skill is interpreting what those numbers are telling you. This is where you learn to read the story behind the data, turning a spreadsheet into a clear investment decision.
These metrics aren't abstract figures; they're signposts pointing you toward risk, opportunity, and whether a property fits your financial goals.

Reading The Story Behind The Metrics
Context is everything. A 6% cap rate might be a fantastic deal in a high-growth coastal market like San Diego, where appreciation is the main goal. That same 6% cap rate in a cash-flow-focused market like Cleveland would be a terrible deal, as local investors there often look for 9% or higher.
Likewise, a lower cash-on-cash return isn't always a deal-breaker. An investor might happily accept a 4% cash-on-cash return on a property in a rapidly gentrifying neighborhood with huge appreciation potential. Someone else might be laser-focused on immediate income and pass on any deal that doesn't clear 10% from day one.
Your job is to decide which story you want your investment to tell.
- Appreciation Strategy: These investors are comfortable with lower immediate cash flow because they're betting on significant property value growth. For them, Total ROI is the hero metric.
- Cash Flow Strategy: These investors want predictable income now. They live and die by the Cash-on-Cash Return metric to ensure the property puts money in their pocket from the start.
There's no single "right" answer. The point is to align a property's financial DNA with your personal investment goals.
Stress-Testing Your Deal For Realistic Risk
The first set of numbers you run is your best-case scenario. Seasoned investors know things rarely go perfectly to plan. They run a sensitivity analysis to see what a deal's true risk profile looks like by intentionally making assumptions worse to see if the investment can take a punch.
This "stress-testing" process helps you answer critical "what if" questions:
- What happens to my cash flow if the vacancy rate jumps from 5% to 10%?
- How does a surprise $5,000 repair bill impact my annual return?
- If interest rates rise and my future refinance options get more expensive, does this deal still hold up?
By running these scenarios through your calculator, you can find a property's financial break-even point. If a deal only works when every assumption is perfect, it’s probably too fragile to be a good investment. To see how much financing can swing your numbers, it's worth exploring strategies to refinance a rental property to boost returns.
A deal that still cash flows—even just a little—when you increase the vacancy and repair budgets is a deal with a solid foundation. This step separates professional underwriting from amateur optimism.
Defining Your Buy Box To Automate Your Search
Once you know which metrics you care about and how much risk you'll tolerate, you can create your personal investment criteria, known as a "buy box." This is a clear, data-driven set of rules for the types of properties you'll consider.
A buy box acts as a filter, saving you from chasing shiny objects that don't fit your strategy. It might look something like this:
- Asset Type: Duplex or triplex
- Market: Indianapolis, IN (specific zip codes)
- Purchase Price: Under $300,000
- Minimum Cap Rate: 7.5%
- Minimum Cash-on-Cash Return: 9%
A defined buy box turns your deal-finding process from a random hunt into a targeted search. On a marketplace platform, you can set up a profile with your exact criteria, and the system will automatically notify you only when a matching property gets listed. This cuts out hours of wasted analysis and ensures you're among the first to see the deals that are a perfect fit.
Once you’ve mastered the core four metrics, it’s time to move beyond the basics and start analyzing deals like a seasoned pro. This is where you find your edge, especially with properties that don’t fit the typical buy-and-hold rental mold.
Metrics like the Internal Rate of Return (IRR) and Gross Rent Multiplier (GRM) provide a different lens through which to see a property’s potential. They don’t replace your core four, but they’re powerful for answering specific questions.
Expanding Your Analytical Toolkit
The Gross Rent Multiplier (GRM) is a quick, back-of-the-napkin number for comparing properties based on raw income. You divide the purchase price by the gross annual rent. A lower GRM is usually better, but because it completely ignores operating expenses, it's a blunt instrument. It's fine for an initial screening, but never make a final decision with it.
The Internal Rate of Return (IRR), on the other hand, is a much more advanced metric. It calculates the total annualized return over the entire life of the investment, factoring in the time value of money. It considers all future cash flows, loan paydown, and the final sale price to produce an effective annual interest rate on your capital. IRR is critical for analyzing deals with irregular cash flows or a specific end date, like a fix-and-flip or a development project.
Calculating Returns For Niche Property Types
Not every investment is a single-family rental. When you analyze alternative deals, you have to adjust your inputs and focus. A good property investment return calculator should be flexible enough to handle these unique scenarios.
- Fix-and-Flip: This is a short-term game. Your key inputs are the purchase price, a detailed rehab budget, holding costs (loan interest, taxes, insurance), and the After Repair Value (ARV). Your main focus is total profit and ROI.
- Land Development: This is about a property's potential. Your inputs will be the land price, entitlement costs, infrastructure expenses, and the projected value of what you build. IRR is king here due to the long timeline and large upfront costs followed by a big payday.
- Student Housing: You need to think on a per-bed basis, not per-unit. Expect higher turnover costs, seasonal vacancy, and potentially higher management fees. The upside is that gross rents are often much higher than traditional rentals.
Tapping Into High-Yield Alternative Sectors
Stepping outside of traditional residential and commercial properties can unlock serious opportunities. Data shows that alternative real estate sectors have been outperforming, posting 11.6% annualized returns over the last decade through 2024, while core properties returned just 6.2%.
This trend appears poised to continue. Deloitte forecasts that these niches—like data centers, life sciences facilities, and student housing—will surge at a 15% compound annual growth rate to 2034, eventually making up nearly 70% of institutional portfolios. You can explore more of these real estate investment trends and their future impact.
The same analytical principles apply, but the inputs change. On a platform with a flexible marketplace, you can source and analyze these diverse asset types using a consistent framework, setting up your investor profile to find deals with returns that mirror the outperformance of these alternative sectors.
Whether you're calculating the profit on a quick flip or the long-term IRR of a development deal, a property investment return calculator does the same job: it provides a structured, data-driven way to model a property's financial future so you can make an informed decision.
Answering Your Top Calculator Questions
Even with a great calculator, you're bound to have questions. When you're in the thick of analyzing a deal, a few common uncertainties can stall your momentum. Let's tackle those head-on so you can make confident decisions.
What’s a "Good" Cash on Cash Return, Really?
This is the most common question, and the honest answer is: there's no magic number. A "good" return depends entirely on your market, strategy, and risk tolerance. That said, a widely accepted benchmark many investors aim for is a cash-on-cash (CoC) return between 8% and 12%.
This range is often seen as a sweet spot—it provides solid monthly income and is still realistic in many markets. But context is everything.
- If you're just starting out: Targeting an 8% CoC return is a fantastic goal. It ensures positive cash flow and gives you a healthy cushion for surprise repairs.
- For experienced pros: In a hot, high-appreciation market like Austin, you might accept a lower CoC, perhaps 4-6%. You're playing the long game, banking on future appreciation. Conversely, a cash flow investor in a stable Midwest market might not consider a deal unless it’s projecting 15% or higher.
The key is to define what a "good" return means for your goals.
Your ideal CoC return isn't a universal standard. It's a personal benchmark that keeps you focused on your own wealth-building strategy.
How Do I Actually Estimate Future Expenses Accurately?
This is the art of deal analysis. Underestimating expenses is the fastest way to turn a promising deal into a financial headache. Rules of thumb like the 50% Rule (which suggests half your gross rent will go to operating expenses, excluding the mortgage) are fine for a quick screening but are too blunt for serious analysis.
To get a sharper picture, you need to break it down:
- Routine Maintenance & Repairs: Budget 5-10% of gross rent. This is for small, predictable stuff—a leaky faucet or running toilet.
- Capital Expenditures (CapEx): Set aside another 5-10% of gross rent for big-ticket items. This is your fund for a new roof or HVAC system. Never skip this line item.
- Vacancy: Assume the property will be empty for at least 5-8% of the year. That’s roughly one month of lost rent, a safe bet in most markets.
- Property Management: Budget 8-10% here, even if you plan to self-manage. You want the deal to work long-term, even if you scale up and need to hire a pro.
The best way to nail your numbers is to get local, property-specific data. A thorough home inspection report is worth its weight in gold—it will tell you the age and condition of major systems, giving you a clearer timeline for big CapEx hits.
Can I Use This Calculator for a BRRRR or a Flip?
Absolutely—you just have to use it in two distinct stages. A standard rental calculator is built for a buy-and-hold analysis, so for a strategy like a BRRRR (Buy, Rehab, Rent, Refinance, Repeat) or a fix-and-flip, you need to adapt.
For a straight flip, your analysis is about the front-end profit. You’ll focus on:
- After Repair Value (ARV): What the property will be worth once the work is done.
- Total Project Costs: The purchase price plus all rehab and holding costs (loan payments, taxes, insurance).
- Net Profit: The number left after subtracting total costs from the ARV.
For a BRRRR, it's a two-step process. First, you run a flip analysis as described above to ensure you can force enough equity to refinance and pull your initial cash back out.
Second, you switch gears and run a standard rental property return calculation. You’ll plug in the new market rents and your projected refinanced loan details. This confirms the property will hit your cash flow and CoC targets as a long-term hold. A successful BRRRR has to work on both ends of the deal.
Ready to stop wrestling with spreadsheets and start making faster, data-driven decisions? On our marketplace, every listing comes with a built-in property investment return calculator, so you can see key metrics instantly. Create your free investor profile to get matched with deals that fit your criteria.