
In fix-and-flip investing, bad math is the fastest way to lose your shirt. A reliable fix flip calculator isn't just a nice-to-have tool; it's the core of your risk management and the key to separating professional, data-driven decisions from expensive guesswork. This guide provides an actionable framework to analyze any potential flip with confidence, whether it's your first deal or your fiftieth.
Why Your Flip Lives or Dies by the Numbers
There’s an old saying in this business: you make your money when you buy, not just when you sell. The success of every project hinges on how accurately you run your numbers at the very beginning. One slip-up in your rehab budget or a misjudged After Repair Value (ARV) can wipe out your profit margin, turning a promising deal into a costly lesson. This is exactly why a solid fix flip calculator becomes your most valuable asset.
This guide breaks down every critical piece of the deal analysis, providing a repeatable system that protects your capital and helps you nail your returns, no matter what the market is doing. We'll start with the fundamentals and layer in nuances for more experienced operators.
Understanding the Financial Stakes
The numbers don't lie. A disciplined approach to your analysis is what separates the pros from the hobbyists who eventually get washed out.
In 2023, the U.S. fix-and-flip market saw roughly 297,885 properties flipped, a major 32.4% drop from its recent peak. And yet, the median gross profit per flip held strong at around $72,000. That resilience tells a clear story: successful flippers protect their margins with precise calculations, even when interest rates are high. You can dig into more of these fix and flip market trends on ahlend.com.
If you’re new, a detailed calculator is your guardrail against catastrophic mistakes. If you’re experienced, it’s a tool for fine-tuning returns and stress-testing deals against market swings, helping you know instantly which deals to chase and which to walk away from.
Key Components of a Solid Flip Analysis
A great analysis isn't just about a final profit number; it's about deeply understanding all the inputs. We're going to walk through the pillars of any comprehensive fix flip calculator. Get these right, and you're set.
- After Repair Value (ARV): This is the projected sale price of the property after you’ve completed all renovations. It’s the single most important number in your calculation.
- Acquisition & Rehab Costs: This covers the full spectrum of your expenses, from the purchase price to the last drop of paint—and, critically, a contingency fund for inevitable surprises.
- Holding & Selling Costs: These are the "silent killers" many investors underestimate, such as loan payments, property taxes, insurance, utilities, and agent commissions.
- Profit & Return Metrics: These are your bottom-line results, including net profit, Return on Investment (ROI), and Cash-on-Cash Return, which tell you if a deal is actually worth your time and capital.
Mastering these elements equips you to evaluate any deal, see its true potential, and invest with the confidence that your numbers are built on a rock-solid foundation.
The Core Numbers That Drive Every Fix and Flip
An accurate flip analysis all comes down to the numbers you feed your fix flip calculator. Getting these right isn’t a simple spreadsheet exercise; it’s the difference between a successful project and a deal that slowly bleeds you dry. One forgotten expense can make your profit vanish before you’ve even picked up a hammer.
Whether you're a beginner learning what After Repair Value (ARV) means or a seasoned pro fine-tuning your underwriting for a shifting market, it all boils down to four main cost buckets.
Acquisition Costs: Getting in the Door
This is your entry point, and it’s always more than just the price tag on the listing. Many investors get tripped up right here by underestimating their initial cash-to-close, starting the project behind from day one.
- Purchase Price: The price you and the seller agree on. It's the biggest check you'll write and the anchor for your entire analysis.
- Closing Costs: Don't forget the pile of fees to make the deal official. Budget 2-5% of the purchase price to cover lender fees (origination points, appraisals), title insurance, attorney fees, transfer taxes, and escrow charges.
Pro Tip: Ask your title company for an estimated settlement statement early in the process. It provides a real-world breakdown of costs so you can ditch the guesswork.
Rehab Budget: Where the Magic (and Mistakes) Happen
Your renovation budget is easily the most volatile part of the equation and where deals truly go off the rails. A detailed, line-item budget is non-negotiable.
If you're new to this, get multiple quotes from vetted contractors. For experienced flippers, this is where you dial in your cost-per-square-foot numbers for different finishes—from a quick cosmetic touch-up to a full gut job—so you can analyze deals in minutes.
Your rehab number must cover every single thing needed to get that property ready for market.
- Materials: Everything from lumber and drywall to paint, flooring, light fixtures, and appliances.
- Labor: The cost for your general contractor and all skilled trades—electricians, plumbers, roofers, and painters.
- Permits & Fees: The money your city or county requires to sign off on the work. Do not skip this.
- Contingency Fund: This is your "uh-oh" fund for surprises lurking behind the walls. A 10-20% buffer on top of your rehab estimate is standard. For an old house, lean closer to 20%.
Holding Costs: The Silent Profit Killer
Holding costs (or carrying costs) are all the expenses that pile up from the day you buy to the day you sell. These time-sensitive costs are silent but deadly, eating away at your profit margin every month your project is delayed.
Here’s what you need to account for in your fix flip calculator:
- Financing Costs: Using a hard money loan? Budget for monthly interest payments, loan servicing fees, and any points paid upfront.
- Property Taxes: You're on the hook for property taxes for every day you own the property.
- Insurance: You’ll need a builder's risk or vacant property policy, which is almost always more expensive than a standard homeowner's policy.
- Utilities: Even an empty house needs power for tools and water for inspections. Factor in electricity, water, and gas.
- HOA Fees: If the property is in a managed community, don't forget the monthly or quarterly HOA dues.
Selling Costs: The Final Hurdle
The renovation is done and the house is on the market. You're almost there, but one last set of costs must be cleared before you can cash that profit check.
- Agent Commissions: This is your biggest selling expense. Expect to pay 5-6% of the final sales price, which is split between your listing agent and the buyer's agent.
- Seller Concessions: It's common for buyers to ask for help with their closing costs. It’s smart to budget 1-2% of the ARV just in case, as it can make your deal more attractive.
- Staging: Professional staging isn't cheap, but it can help a property sell faster and for a higher price. Costs can run from a few hundred to several thousand dollars.
- Closing Costs (Seller Side): Just like when you bought, selling has its own set of fees. This includes your share of transfer taxes, attorney fees, and other settlement charges.
While these expenses are critical, it's just as important to understand how they plug into broader investment metrics like Cap Rate. To get a better handle on another key real estate metric, you can explore our detailed guide on how to calculate cap rate.
Comprehensive Fix and Flip Deal Analysis Checklist
Use this detailed checklist to build your own spreadsheet or double-check a deal before you pull the trigger.
| Category | Line Item | Beginner Tip | Experienced Investor Tip |
|---|---|---|---|
| Acquisition | Purchase Price | The listed price is a starting point, not the final number. | Analyze recent comparable sales (comps) to make sure you're not overpaying from day one. |
| Buyer Closing Costs | Ask your lender for an itemized Loan Estimate. | Negotiate lender fees and shop around for title insurance to reduce costs. | |
| Rehab | Materials | Price out big-ticket items like appliances and flooring early. | Build relationships with suppliers for bulk discounts or contractor pricing. |
| Labor | Get at least 3 detailed bids and check references. | Have a trusted General Contractor and a backup for each key trade (plumbing, electrical). | |
| Permits | Call your local building department to understand permit timelines and costs. | Factor permit "dead time" (waiting for inspections) into your project schedule. | |
| Contingency | Always include this. 10% is the absolute minimum. | For historic homes or properties with known issues (foundation, plumbing), push this to 20%+. | |
| Holding | Financing (Interest) | Calculate the total interest payments based on your estimated project timeline. | Model scenarios for 3, 6, and 9-month holds to see how delays impact profit. |
| Property Taxes | Prorate taxes for your estimated holding period. | Appeal the property's tax assessment if you believe it's unfairly high. | |
| Insurance | Get quotes for a "Builder's Risk" policy before you close. | Annually review your insurance provider to ensure you're getting the best rate. | |
| Utilities | Budget a fixed monthly amount for basic utilities. | Install a smart thermostat to manage HVAC costs remotely, especially during winter. | |
| Selling | Agent Commissions | Understand that 5-6% is standard, but can sometimes be negotiated. | If doing multiple deals, discuss a reduced commission rate with a preferred agent. |
| Seller Concessions | In a buyer's market, assume you'll pay some concessions. | Use concessions strategically to close a deal faster instead of making another price reduction. | |
| Staging | For vacant homes, staging often has a very high ROI. | Own a basic "vignette" staging kit for smaller properties to save on rental costs. | |
| Seller Closing Costs | Budget 1-2% for miscellaneous transfer taxes, attorney fees, etc. | Review your settlement statement carefully for any junk fees or errors before signing. |
Successful flippers live by these details. Overlooking even one small item can unravel an otherwise great deal.
How to Build Your Own Fix Flip Calculator
Knowing the metrics is one thing; putting them to work is where you find your edge. Let's move from theory to practice by building a powerful, custom fix flip calculator in a simple spreadsheet like Google Sheets or Microsoft Excel.
We'll lay out the core structure and formulas you need to build a tool that you own, understand inside and out, and can tweak for any deal. The goal is a dynamic dashboard where you input key numbers and instantly see your total costs, potential profit, and the return metrics that actually matter.
Setting Up Your Calculator Input Fields
First, create a clean, organized spot for all your inputs. This is where you'll enter the numbers for every deal you analyze. A logical layout here prevents mistakes when you're in a hurry.
Create two columns: one for labels (e.g., "Purchase Price") and one for the numbers.
Key Input Categories to Include:
- Property Information: Property address and maybe a link to the listing.
- Acquisition Costs: Purchase Price and estimated Buyer Closing Costs.
- Financing Details: Loan Amount, Down Payment, Interest Rate, and any Origination Points.
- Rehab & Holding: Rehab Budget, a Contingency Fund (as a percentage), and your Estimated Project Timeline in months.
- Selling Projections: After Repair Value (ARV), Agent Commissions, and other Seller Closing Costs.
If you’re new, start simple. Get the main numbers in there: purchase price, total rehab, ARV, and major costs. You can add detail later.
If you’re experienced, build in flexibility. Add inputs for different financing types (hard money vs. conventional) or a toggle to compare a cash purchase against a leveraged one to run scenarios in seconds.
Crafting the Core Formulas
With your inputs organized, it's time to make the spreadsheet do the heavy lifting. Formulas will connect your inputs to generate the outputs that tell you if a deal is a winner. This diagram shows how money flows through a project, from purchase to final sale.
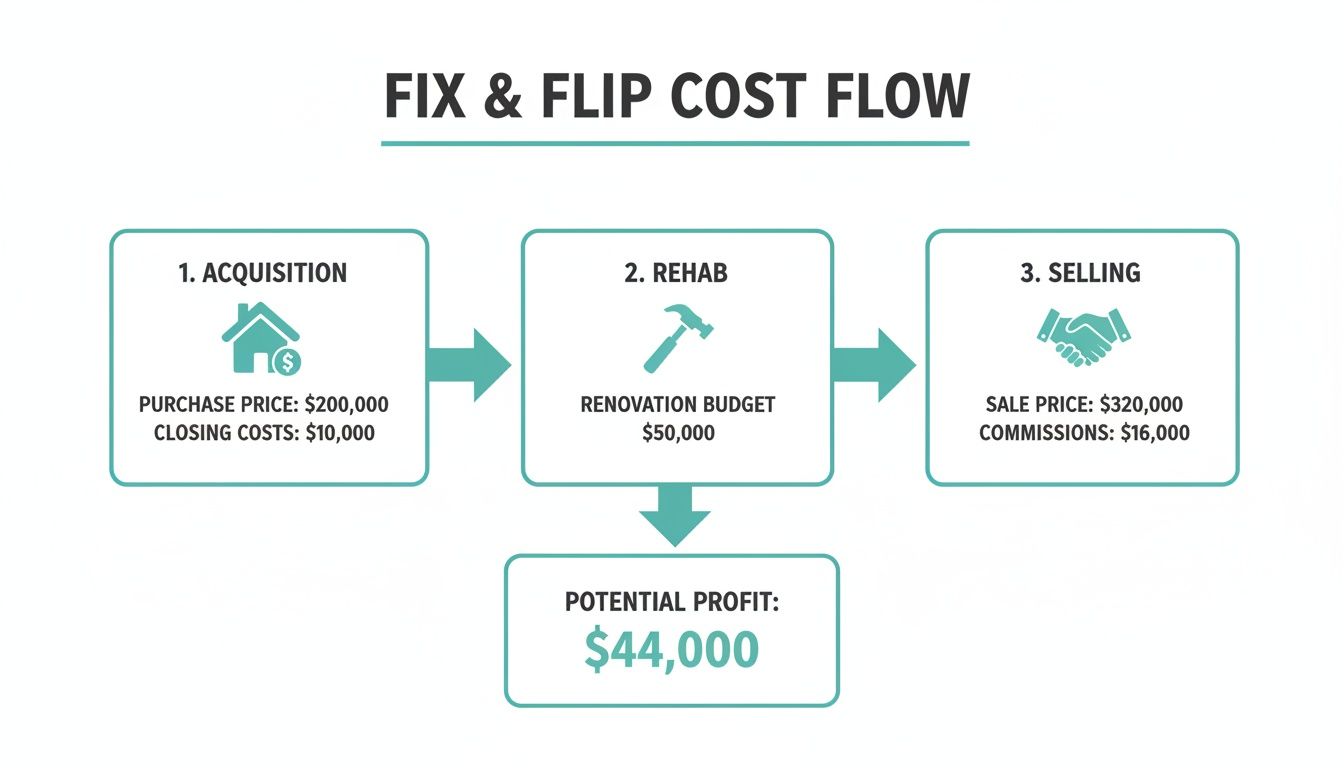
Your profit is what’s left after every cost is stripped from the final sales price. Let’s build the formulas to calculate that automatically.
Calculating Your Total Project Investment
First, you need to know your total cash outlay and the all-in cost of the project.
- Total Cash Needed to Close: This is your down payment plus buyer closing costs. The formula is:
=(Purchase Price * Down Payment %) + (Purchase Price * Buyer Closing Costs %) - Total Project Cost: This is the grand total of every dollar spent. A simple version is:
=Purchase Price + Rehab Budget + Total Holding Costs + Total Selling Costs
Next, calculate your holding and selling costs using the inputs you already created.
- Monthly Holding Costs: This includes loan interest, taxes, insurance, and utilities. For interest, the formula is:
=(Loan Amount * Interest Rate) / 12. Add fixed monthly estimates for the other items. - Total Holding Costs: This is your monthly cost multiplied by your project timeline:
=Monthly Holding Costs * Estimated Project Timeline (in months) - Total Selling Costs: This is mainly agent commissions plus other seller-paid fees. The formula is:
=(ARV * Agent Commission %) + (ARV * Seller Closing Costs %)
Determining Profit and Returns
Now for the rewarding part—seeing what you’ll actually make. This is where we calculate profit and key return metrics.
Estimated Net Profit: The simplest number on the sheet. It's your final sales price minus all costs.
- Formula:
= ARV - Total Project Cost
- Formula:
Return on Investment (ROI): This metric measures your net profit against the total cost of the project, showing how hard your total capital is working.
- Formula:
= Net Profit / Total Project Cost - Format this cell as a percentage. A 15% ROI means for every dollar invested, you got 15 cents back in profit.
- Formula:
Cash-on-Cash (CoC) Return: For investors using loans, this is arguably the most important metric. It measures your net profit against only the actual cash you personally invested.
- Formula:
= Net Profit / Total Cash Needed to Close - This formula shows the power of leverage. A deal with a solid 15% ROI might have an incredible 45% Cash-on-Cash Return if you used a loan.
- Formula:
Building your own spreadsheet is invaluable. But in a hot market, manual data entry is slow. To move faster, you can use the integrated investment calculators on our platform, which often pre-populate data and help you vet deals in a fraction of the time.
Stress-Testing Your Deals with Scenario Analysis
A good fix flip calculator does more than basic math; its real value is in stress-testing a deal before you risk a single dollar. Running numbers for a single, best-case outcome isn’t analysis; it’s wishful thinking. Pros underwrite for reality, which means planning for things to go wrong.
This is where you move from simple calculations to real risk assessment. By running multiple versions of the deal, you see how your profit holds up under pressure.
Running Different Deal Scenarios
To find a project's weak spots, you have to see what happens when the market or your budget takes a hit. Let's run three common scenarios through our calculator using a hypothetical deal with a $300,000 purchase price and a $50,000 rehab budget.
Scenario 1: The 'Home Run' Deal Everything goes perfectly.
- Final Sales Price (ARV): $450,000 (You timed the market perfectly)
- Rehab Costs: $50,000 (Right on budget)
- Holding Time: 4 Months (Fast reno, quick sale) In this scenario, your profit is fantastic. It's the outcome you aim for, but not the one you should bank on.
Scenario 2: The 'Tight Margin' Deal A more common situation. The deal works, but there’s not much breathing room.
- Final Sales Price (ARV): $425,000 (Market is flat)
- Rehab Costs: $55,000 (A few small surprises)
- Holding Time: 6 Months (Buyer’s financing dragged) Here, your profit shrinks. The deal is still a solid single, but it shows why controlling costs and timeline is critical.
Scenario 3: The 'Uh-Oh' Deal This is the one that keeps investors up at night. A major problem pops up, and the market turns against you.
- Final Sales Price (ARV): $410,000 (Market softened, forcing a price drop)
- Rehab Costs: $70,000 (Surprise! A hidden foundation issue)
- Holding Time: 8 Months (Major delays from extra repairs) This is where a good deal can go bad, fast. Your profit might evaporate, or you could even lose money. Running this "worst-case" analysis is non-negotiable because it shows a deal’s breaking point.
A deal’s true strength isn’t measured by its best-case potential, but by its ability to remain profitable when things don’t go perfectly. If a project only works with ideal numbers, it’s probably a deal you should pass on.
The Power of Sensitivity Analysis
Sensitivity analysis gets granular by tweaking one variable at a time to see its direct impact on net profit. It answers questions like, "What happens if the rehab budget goes 15% over?" or "How much can the sales price drop before I'm in the red?"
Here’s how to do it in your spreadsheet:
- Pinpoint Risky Variables: Zero in on the inputs with the most uncertainty—usually ARV, rehab costs, and holding time.
- Make Small Adjustments: Change one variable at a time. Drop your ARV by $5,000, then $10,000, and watch what happens to your profit.
- Find Your Break-Even Point: Figure out the exact point where your net profit hits zero.
This process reveals which variables pose the biggest threat. For most fix and flip projects, holding time is a silent killer, as interest payments accumulate. If you're weighing financing options, it's smart to learn about hard money and construction loans to see how their terms affect your holding costs.
How to Accelerate Your Deal Analysis
Building your own spreadsheet is a great way to learn the mechanics of a deal. But in a competitive market, speed is everything. The time you spend hunting down data and plugging it into a spreadsheet is time another investor is using to make an offer. This is where modern real estate platforms provide a serious advantage.
While your custom fix flip calculator is perfect for deep dives, integrated analysis tools on investor marketplaces are built for speed. They often come with property data pre-populated, saving you from the tedious grind of manual data entry and shifting your workflow from information gathering to strategic decision-making.
From Manual Entry to Instant Analysis
The real power of these platforms is changing how you source opportunities. Instead of grinding through one deal at a time, you can screen dozens simultaneously against your specific investment criteria.
On our marketplace, you can set up a "buy-box." This is a dynamic filter that hunts for you, defining what a perfect deal looks like on your terms.
- Target ROI: Set the minimum Return on Investment you’re willing to consider.
- Cash-on-Cash Return: Define the cash return you need to see on your own money.
- Geographic Focus: Pinpoint the exact cities, counties, or zip codes you want to operate in.
- Property Specs: Filter by price range, square footage, bed/bath counts, and more.
Once you’ve set your criteria, the platform automatically flags new listings that hit your numbers. You stop actively hunting for deals and let qualified opportunities come directly to you.
Capitalizing on Market Momentum
This efficiency is critical in a hot market. Recent analysis shows the Fix and Flip Market Index (FFMI) just had its largest quarterly gain in three years, and 71% of investors expect to increase their purchases. In an environment like that, the ability to analyze and act in minutes, not hours, is what separates the winners. You can see how the fix and flip market is set for growth on jbrec.com to dig into more of this data.
The competitive advantage is clear: while others are stuck in spreadsheets, you’re already evaluating a curated list of deals that fit your exact financial goals.
This speed allows you to analyze a much higher volume of properties without sacrificing the quality of your underwriting. You can quickly toss aside deals that don't work and focus your energy on the ones with real potential, letting you find the winner faster and close more deals.
Common Fix and Flip Calculation Questions
Even the slickest spreadsheet runs into reality. Once you’re in the field analyzing an actual deal, a new set of practical questions always pops up. Let’s tackle some of the most common sticking points that trip up investors.
How Do I Accurately Estimate Rehab Costs If I Am Not a Contractor?
Nailing your rehab budget is everything. The best approach is to get your boots on the ground. Start building relationships with trusted local contractors and walk potential properties with them. For any deal you're seriously considering, get at least two or three itemized quotes for big-ticket items like the roof, HVAC, kitchen, and bathrooms.
For quick screening, many investors use a cost-per-square-foot range common for their market.
- Cosmetic Rehab: Paint, flooring, and new fixtures. Usually runs $20-$60 per square foot.
- Full Gut Rehab: Can easily jump to $100+ per square foot, especially for an older home needing major system work.
What Is a Good Profit Margin for a Fix and Flip?
There’s no single "right" answer, as it depends on your market, property price point, risk, and project timeline. That said, many successful flippers use the 10-15% rule as a solid starting point for their analysis.
A common approach is to aim for a net profit of at least 10-15% of the After Repair Value (ARV). On a $400,000 ARV, this would mean a net profit of $40,000 to $60,000. In high-cost areas, a lower percentage on a pricier property can still be a fantastic deal.
How Much Should I Set Aside for a Contingency Fund?
Don't skip the contingency fund. It’s the buffer that saves you from inevitable surprises. The industry standard is to budget a contingency of 10-20% of your total estimated repair costs.
- For beginners or on older homes: Play it safe and aim for 20%. It’s better to have it and not need it.
- For experienced flippers on straightforward projects: You might feel comfortable with 10%.
Should My Fix Flip Calculator Include Financing Costs?
Absolutely, 100%. Your holding costs must account for every dollar related to financing. Forgetting these costs is one of the fastest ways a profitable-looking deal turns into a money pit.
Make sure your calculator has line items for:
- Loan origination points (upfront fees)
- Monthly interest-only payments
- Appraisal and lender processing fees
- Any other miscellaneous lender fees
Overlooking these will completely wreck your profit projections and lead to ugly surprises at the closing table.
Ready to move from manual spreadsheets to faster, smarter deal analysis? Create your free investor profile to get matched with deals that fit your criteria. You can set your buy-box and instantly see properties that meet your exact ROI and cash-on-cash return targets on https://www.investordealexchange.com.