Knowing how to calculate return on investment (ROI) is the difference between guessing and making a smart, data-driven decision on a rental property. The basic ROI formula is simple: divide your net annual profit by your total investment cost. But to truly understand a deal's potential, you need to master different types of ROI, like Cash-on-Cash Return and Total ROI, to ensure you're not leaving money on the table.
This guide will walk you through the exact steps to analyze a deal, from gathering the right numbers to applying the core formulas every successful investor uses.
Why Mastering ROI Is Crucial for Smart Investing
Before diving into the math, it's important to understand why this skill is the bedrock of a successful real estate portfolio. Learning to calculate ROI isn't just an academic exercise; it’s the discipline that lets you make objective, data-driven decisions. Without it, you’re investing on emotion.
A sharp ROI analysis is your best filter for weeding out bad deals and spotting the ones with real potential. It forces you to look past staging and curb appeal to focus on what matters most: financial performance. This is non-negotiable, whether you're analyzing your first deal or your fiftieth.
- If you're new, a solid understanding of ROI gives you the confidence to analyze your first deal and make a compelling case to lenders.
- If you're experienced, it’s the discipline that allows you to scale your portfolio, ensuring every new property meets your strict financial standards.
The Different Lenses of Profitability
Not all ROI metrics tell the same story, and a savvy investor knows how to use each one to get a complete financial picture. Throughout this guide, we'll dive deep into the "Big Three" metrics that every real estate investor should know:
- Cap Rate: This shows a property's unleveraged return, making it perfect for an apples-to-apples comparison between different assets.
- Cash-on-Cash Return: This metric gets straight to the point—it tells you the return on the actual cash you put into the deal, highlighting the power of financing.
- Total ROI: This is the most comprehensive view. It accounts for cash flow, equity built from loan paydown, and the property's appreciation over time.
The ability to accurately project returns is what unlocks consistent growth. It transforms investing from a gamble into a predictable business process.
The Power of Data-Driven Decisions
This data-first approach is precisely how modern investment platforms help investors. Once you define your target ROI metrics in your buy-box, you can use technology to sift through thousands of listings and surface only the ones that meet your financial goals. On our platform, this turns a manual, time-consuming analysis into an efficient, repeatable system.
Historically, this strategy has paid off. Leveraged single-family rentals in the U.S. delivered an impressive 11.7% annual ROI over the last two decades when combining property appreciation and rental income. You can learn more about the historical performance of rental homes to see how these returns break down year over year. Knowing these benchmarks helps you set realistic expectations and spot opportunities that align with proven, long-term strategies.
Gathering the Data for Your Deal Analysis

Before you can run the numbers on a potential rental, you have to gather clean, reliable data. Your financial analysis is only as good as the inputs you use. An analysis built on flimsy assumptions or bad numbers will give you a dangerously flawed result, leading to expensive mistakes.
The goal is to build a complete picture of every dollar that will go into and come out of this property. It all breaks down into two categories: one-time acquisition costs and ongoing operating expenses.
The Upfront Acquisition Costs
This is your "all-in" number—the total cash you need to bring to the table to close the deal and get the property rent-ready. Your total investment isn't just the purchase price; it's the sum of every out-of-pocket expense you'll face upfront.
- Purchase Price: The agreed-upon sale price for the property.
- Down Payment: The portion of the purchase price you pay in cash. For a conventional investment property loan, this is typically 20% to 25%.
- Closing Costs: Fees required to finalize the transaction. Budget between 2% to 5% of the loan amount for items like appraisal fees, loan origination, title insurance, and attorney fees.
- Initial Repair Budget: This covers immediate repairs or renovations needed to make the property safe, functional, and attractive to tenants. This is a critical number where new investors often get burned.
Getting the rehab budget right is absolutely critical. Underestimate it, and you could wipe out your entire projected cash-on-cash return before you even place a tenant. Experienced investors know to get detailed quotes from contractors before closing.
Ongoing Operating Expenses
Once you own the property, the expenses don't stop. These are the recurring costs that will reduce your gross rental income each month. The difference between your total income and these operating expenses gives you your Net Operating Income (NOI)—a foundational metric for almost every ROI calculation.
Pro Tip: Never rely solely on the seller's provided expense numbers. Always conduct your own due diligence. Verify costs like property taxes and insurance rates yourself, as what they paid may not be what you will pay.
Here are the core operating expenses you must account for:
- Property Taxes: You can usually find this information on the county assessor's website. Be aware that a sale can trigger a tax reassessment.
- Insurance: Get quotes for a landlord policy, which is different and typically more expensive than a standard homeowner's policy.
- Vacancy Reserve: No property stays occupied 100% of the time. A conservative approach is to set aside 5% to 10% of the gross monthly rent to cover periods when the unit is empty.
- Repairs and Maintenance: Things will break. A common rule of thumb is to budget 1% to 2% of the property's value annually for these ongoing costs.
- Property Management Fees: Even if you plan to self-manage, include this. Your time has value. Plug in a fee of 8% to 10% of gross rent to keep your analysis objective.
- Utilities: Determine which utilities (water, sewer, trash, etc.) will be your responsibility and which the tenant will cover.
Gathering this data is tedious but is the single most important step in the process. While a marketplace like Investor Deal Exchange can help by pre-populating some of this data, it’s always your job as the investor to verify every number and build an analysis you can stand behind.
Essential Data Checklist for Rental Property ROI Calculation
This table breaks down the crucial financial inputs required to accurately calculate key performance metrics for a rental property.
| Data Category | Specific Inputs to Gather | Pro Tip and Common Pitfall |
|---|---|---|
| Property & Purchase | Purchase Price, Down Payment Amount, Loan Terms (Interest Rate, Term) | Pro Tip: Your interest rate dramatically impacts cash flow. Get pre-approved to use a real rate. Pitfall: Forgetting to account for an appraisal gap if the property doesn't appraise for the contract price. |
| Upfront Costs | Closing Costs (budget 2%-5% of loan), Initial Repair/Renovation Budget | Pro Tip: Always get a detailed SOW (Scope of Work) from a contractor for rehab costs. Pitfall: Underestimating the rehab budget. Add a 10-15% contingency for unexpected issues. |
| Rental Income | Gross Monthly Rent, Other Income (pet fees, laundry, parking) | Pro Tip: Verify rent comps yourself using tools like Rentometer or by checking local listings. Pitfall: Trusting the seller's "pro forma" or projected rents without independent verification. |
| Operating Expenses | Property Taxes, Landlord Insurance, Vacancy Rate (budget 5%-10%), Repair/Maintenance Reserve (1%-2% of property value annually) | Pro Tip: Call an insurance agent for a real quote on a landlord policy. Pitfall: Forgetting to budget for vacancy. No property stays rented 365 days a year. |
| Other Expenses | Property Management Fees (budget 8%-10%), HOA Fees, Utilities (if not paid by tenant), CapEx (Capital Expenditures) Reserve | Pro Tip: Include a management fee even if you self-manage. Your time isn't free. Pitfall: Ignoring CapEx for big-ticket items like a new roof or HVAC. These will come due eventually. |
With these numbers in hand, you're ready to move from guessing to calculating. You've laid the groundwork for a solid, defensible analysis that will tell you if this deal is a winner or one you should walk away from.
The Core Formulas: Cap Rate, Cash-on-Cash, and Total ROI
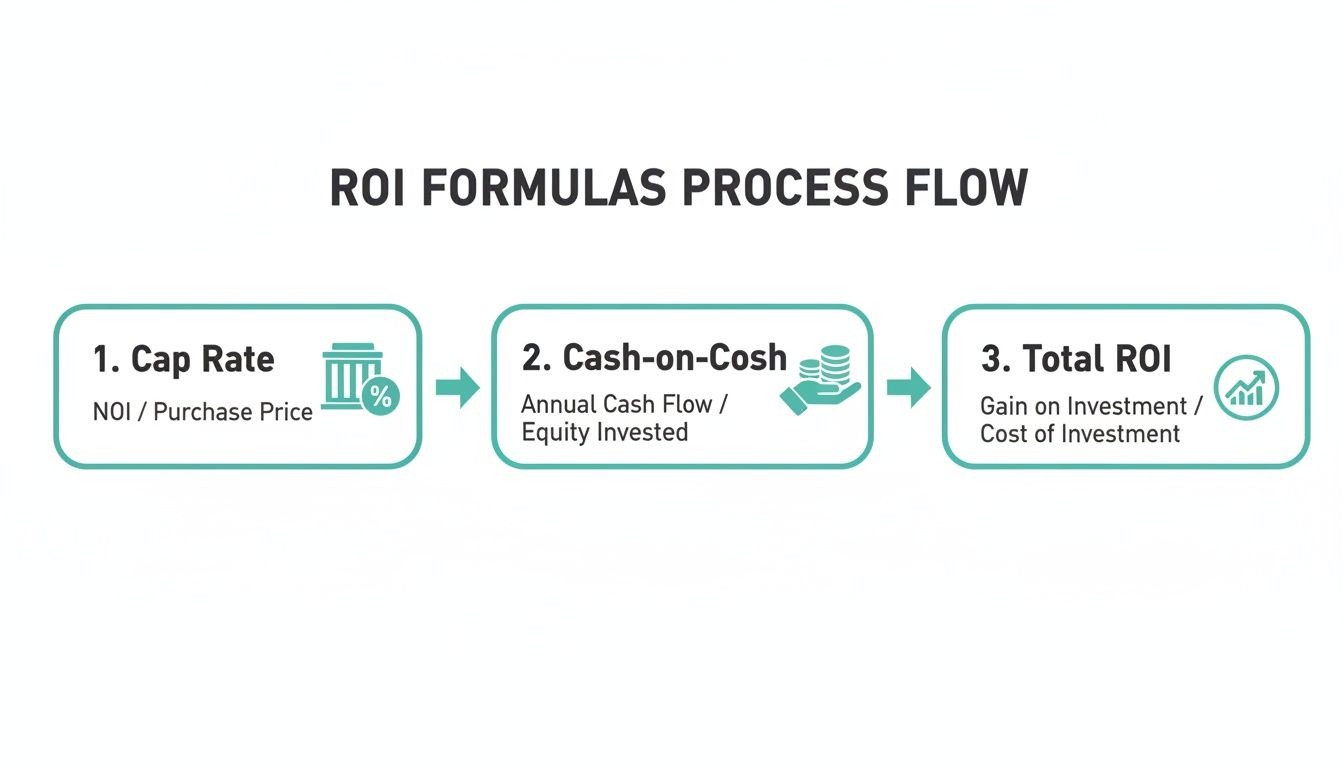
Once you've gathered your numbers, it's time to put them to work. In real estate investing, three core formulas will tell you almost everything you need to know about a deal's financial health.
Think of them as different lenses for looking at the same property. Each one gives you a unique perspective, and together, they paint a complete financial picture. One shows the property's raw earning power, another shows how financing affects your wallet, and the last reveals the long-term wealth-building potential.
Capitalization Rate: The Apples-to-Apples Comparison
First is the Capitalization Rate, or Cap Rate. This is the purest measure of a property's income potential. It tells you the annual return you’d get if you bought the property with all cash, no mortgage involved.
Because it ignores financing, it's the perfect tool for comparing one property directly against another. It answers one simple question: which asset is the better income-producer?
The formula is straightforward:
Cap Rate = Net Operating Income (NOI) / Property Value
Your NOI is your total annual rental income minus all operating expenses (but not your mortgage payment). The property value is simply the purchase price.
Let's use a quick example:
- A property costs $300,000.
- Its annual NOI is $18,000.
- The math is: $18,000 / $300,000 = 0.06, or a 6% Cap Rate.
That 6% figure is incredibly useful when you're sorting through listings. For a deeper dive, check out our guide on how to calculate cap rate and why it matters.
Cash-on-Cash Return: Your Personal Profit Engine
While Cap Rate focuses on the property, Cash-on-Cash (CoC) Return is all about you. This metric answers the most important question for any investor using a loan: "For every dollar I personally put into this deal, how many cents am I getting back each year?"
It measures the return on your actual out-of-pocket cash, making it one of the most powerful gut checks for a leveraged investment.
Here's how you calculate it:
Cash-on-Cash Return = Annual Pre-Tax Cash Flow / Total Cash Invested
Your Annual Pre-Tax Cash Flow is your NOI minus your total annual mortgage payments. Your Total Cash Invested is your down payment, closing costs, and initial repair budget combined.
Let’s build on our example:
- Total Cash Invested: $60,000 down payment (20%) + $9,000 closing costs + $10,000 for initial repairs = $79,000.
- Annual Mortgage Payment: Let's say it's $14,400.
- Annual Pre-Tax Cash Flow: $18,000 (NOI) - $14,400 (Mortgage) = $3,600.
- The CoC calculation is: $3,600 / $79,000 = 0.045, or 4.5%.
Whether a 4.5% CoC return is "good" depends entirely on your market and strategy. Many investors aim for 8-12%, but in an area with strong appreciation potential, a lower cash flow might be an acceptable trade-off.
Total ROI: The Complete Wealth-Building Picture
Cash flow is critical, but it’s only one piece of the puzzle. Real estate builds wealth in several ways at once, and Total ROI is the metric that captures the full story. It combines your annual cash flow with the equity you're gaining from both the property's appreciation and your loan being paid down.
This is where you see the true financial power of holding a rental property over time.
The formula looks like this:
Total ROI = (Annual Cash Flow + Annual Equity Growth) / Total Cash Invested
Your Annual Equity Growth is the sum of the principal you paid down on your mortgage that year plus the amount the property's value increased (appreciation).
Let's finish our example after one year of ownership:
- Annual Cash Flow: Still $3,600.
- Principal Paid Down: Let's say $4,000 of your mortgage payments went to principal in the first year.
- Appreciation: We'll assume a conservative 4% appreciation on the $300,000 property, which adds $12,000 in value.
- Total Annual Equity Growth: $4,000 + $12,000 = $16,000.
- The final calculation: ($3,600 + $16,000) / $79,000 = $19,600 / $79,000 = 0.248, or 24.8%.
Suddenly, that investment looks much more attractive. A 24.8% Total ROI shows how a property with modest cash flow can still be a phenomenal wealth-building machine. Mastering these three formulas gives you the tools to analyze any deal from every angle, ensuring you make smart, confident investment decisions.
Running the Numbers on a Real-World Property
Formulas are one thing, but the real test is applying them to an actual deal. Let’s walk through a realistic scenario for a single-family rental to see how these metrics work together and what story they tell.
This is the exact process you can use to analyze any rental property. We'll start with the property's raw numbers and then see how adding financing changes the picture.
The Property Profile
Imagine you've found a promising three-bedroom, two-bath house in a solid B-class neighborhood. After doing your due diligence, you've gathered the following numbers:
- Purchase Price: $300,000
- Gross Monthly Rent: $2,500 (or $30,000 annually)
- Annual Property Taxes: $3,600
- Annual Landlord Insurance: $1,200
- Vacancy Reserve (5%): $1,500
- Maintenance & Repairs (8%): $2,400
- Property Management (8%): $2,400
First, we need to calculate the Net Operating Income (NOI).
NOI = Gross Annual Rent - Total Operating Expenses $30,000 - ($3,600 + $1,200 + $1,500 + $2,400 + $2,400) = $18,900
With our NOI, we can calculate the property's unleveraged return—its Cap Rate. This tells us what the property earns on its own, without debt.
Cap Rate = NOI / Purchase Price $18,900 / $300,000 = 0.063, or a 6.3% Cap Rate.
A 6.3% Cap Rate is a solid, objective starting point. It's the property's raw earning power and lets you compare this deal to others on an apples-to-apples basis.
Introducing a Financing Scenario
Now, let's be realistic—most investors use financing. Assume you get a conventional investment loan with these terms:
- Down Payment (20%): $60,000
- Closing Costs (3%): $9,000
- Initial Repair Budget: $5,000 (for new paint and carpet)
- Total Cash Invested: $60,000 + $9,000 + $5,000 = $74,000
Your loan amount is $240,000. On a 30-year term at a 6.5% interest rate, your monthly principal and interest payment is about $1,517. That’s $18,204 in annual debt service.
Instead of manual calculations, our platform's investment property calculators let you plug in these variables and get instant results. With the loan details sorted, we can now calculate your Cash-on-Cash Return.
Annual Cash Flow = NOI - Annual Debt Service $18,900 - $18,204 = $696
Cash-on-Cash Return = Annual Cash Flow / Total Cash Invested $696 / $74,000 = 0.0094, or a 0.94% CoC Return.
This is a critical moment in deal analysis. A cash-on-cash return under 1% is razor-thin. It indicates almost no buffer for unexpected vacancies or a major repair. For many experienced investors, this number alone would be a reason to walk away or renegotiate the price.
Projecting the Total ROI
But cash flow is just one piece of the puzzle. Let's look at the Total ROI after year one, which includes the other ways you build wealth.
- Loan Principal Paid Down: In the first year, roughly $3,050 of your mortgage payments went directly toward paying down the loan balance.
- Property Appreciation: Assuming a conservative 4% annual appreciation, the property's value increased by $12,000 ($300,000 x 0.04).
Now we can see the full picture.
Total Annual Gain = Annual Cash Flow + Principal Paydown + Appreciation $696 + $3,050 + $12,000 = $15,746
Total ROI = Total Annual Gain / Total Cash Invested $15,746 / $74,000 = 0.212, or 21.2% Total ROI.
This example perfectly illustrates why you must look at all three metrics. The low cash flow is a major red flag for short-term stability, but the strong 21.2% Total ROI shows serious long-term, wealth-building potential.
This is exactly why on our marketplace, you can see all these calculations laid out side-by-side, helping you make a balanced decision without having to build a complex spreadsheet from scratch.
Advanced ROI Considerations and Common Pitfalls
Mastering the core formulas is a major step, but the nuances are what separate casual investors from professionals who build serious wealth. Once you can confidently calculate ROI on a rental property, it’s time to look beyond today’s return and start thinking about long-term performance and potential risks.
This is where you shift from "What's the return now?" to "What could the return be if things don't go perfectly?" It’s about stress-testing your assumptions and getting realistic about long-term ownership.
Beyond NOI: The Power of Depreciation
One of the most powerful benefits of owning rental property is depreciation. This is a non-cash expense the IRS allows you to deduct to account for the wear and tear on your property. For residential rentals, you can typically depreciate the value of the building (not the land) over a 27.5-year period.
This annual deduction lowers your taxable rental income, which means you pay less in taxes and keep more of the cash your property generates. While it doesn't change your actual cash flow or appear in your NOI calculation, it directly boosts your after-tax return—a critical metric for long-term wealth building.
Budgeting for Capital Expenditures
Your regular maintenance budget is for small items like a leaky faucet. Capital Expenditures (CapEx), on the other hand, are the big-ticket replacements that can wreck your finances if you're not prepared.
We’re talking about items like:
- A new roof: Easily $10,000 or more.
- An HVAC system: Can run from $5,000 to $12,000.
- A water heater: Can set you back over $1,500.
Forgetting to set aside money for CapEx is a classic rookie mistake. A good rule of thumb is to budget an extra 1-3% of the property's value each year, or a set amount like $50-$150 per unit per month, specifically for these future expenses.
A deal that looks fantastic on paper can go negative in a heartbeat when a 15-year-old roof fails. When you budget for CapEx proactively, you turn a potential financial emergency into a predictable business expense.
Stress-Testing Your Deal with Sensitivity Analysis
This is where you play devil's advocate with your own analysis. A sensitivity analysis is simply changing your key assumptions to see how badly it hurts your returns. It's how you find a deal's weak points and understand your true risk.
Ask yourself the tough "what if" questions:
- What happens to my cash flow if vacancy spikes to 15% for six months?
- How much does a 1% jump in my mortgage rate affect my Cash-on-Cash Return?
- If my property taxes get reassessed and increase by 20%, is this deal still profitable?
Running these scenarios shows you how much of a buffer you actually have. A deal that only works under perfect conditions is fragile. The best deals are the ones that still perform well even when a few things inevitably go wrong.
If you're looking for ways to bulletproof your financing, our guide on how to refinince a rental property covers strategies that can significantly improve your numbers.
The Questions Every Investor Asks About ROI
Once you get past the basic formulas, the practical questions start. These are the details that separate a spreadsheet fantasy from a deal that works in the real world. Let's cover a few of the most common questions investors ask.
What’s a “Good” ROI for a Rental Property?
There’s no single magic number. A “good” return depends entirely on your market, strategy, and risk tolerance. However, there are common targets that experienced investors use as a benchmark.
- Cash-on-Cash Return: Many buy-and-hold investors target an 8-12% cash-on-cash return. This range often indicates healthy cash flow after all expenses and debt service are paid.
- Total ROI: When you factor in appreciation and loan paydown, a common goal is to see a total return of 15% or higher.
Remember, these are just guidelines. An investor in a high-appreciation market might accept a 5-7% Cash-on-Cash Return, betting on long-term growth. In contrast, an investor focused on cash flow in the Midwest might pass on anything that doesn't hit 10% CoC from day one.
Ultimately, a "good" ROI is one that meets your personal financial goals and adequately compensates you for the risk and effort involved.
How Do I Handle Future Rent Growth and Appreciation?
For your initial analysis, be conservative. Use today's actual market rents and a realistic appreciation rate. A safe starting point is the historical U.S. average of 3-5% for appreciation. This forces you to buy a property that makes sense now, not one that only works if everything goes perfectly for the next five years.
For a deeper analysis, you should model future scenarios. A good deal analysis tool will let you input assumptions, like a 3% annual rent increase, to project how the property will perform over a five or ten-year hold. It helps you see the long-term power of the investment, but it should never be a substitute for making sure the numbers work on day one.
Should I Factor in Management Fees if I’m Going to Self-Manage?
Yes. One hundred percent. Always include a standard property management fee—typically 8-10% of the gross monthly rent—in your expense calculations, even if you plan to do it yourself.
This practice is crucial for two reasons:
- It Pays You for Your Work. Your time isn't free. This line item ensures you're compensating yourself for the hours spent dealing with tenants, maintenance, and administrative tasks.
- It Future-Proofs Your Deal. What if you want to scale your portfolio or get tired of 2 a.m. maintenance calls? By underwriting the deal with a management fee, you know the property can support a professional manager down the road without destroying your cash flow. It forces you to evaluate the property as a true asset, not just a part-time job.
How Do Investor Marketplaces Make This Easier?
This is where platforms built for investors really shine. Instead of building a new spreadsheet for every single property, you can use tools designed to do the heavy lifting for you.
On our marketplace, for example, many listings come with built-in calculators pre-loaded with key information like list price, property taxes, and market rent estimates. You can simply adjust the numbers unique to your situation—your down payment, interest rate, or renovation budget—and instantly see the impact on your Cap Rate, Cash-on-Cash Return, and Total ROI. This process cuts out tedious data entry, reduces the chance of errors, and lets you analyze a dozen deals in the time it used to take to analyze one.
Mastering how to calculate ROI on a rental property is the key to building a profitable portfolio. By using the right data and formulas, you can move from uncertainty to confidence with every deal you analyze.
Create your free investor profile to get matched with deals that fit your criteria.