When you’re staring at a mountain of property listings, trying to figure out which deals are worth your time can feel overwhelming. You need a fast, reliable way to filter opportunities and focus on what matters.
That's where the Gross Rent Multiplier (GRM) comes in. Think of it as a quick, back-of-the-napkin calculation for real estate investors. It’s a straightforward metric that helps you compare a property’s price to its income before you dive into a full spreadsheet analysis, helping you decide if a deal is even worth a closer look.
Understanding The Gross Rent Multiplier

At its core, GRM answers a simple question: How many years would it take for the property's gross rental income to pay for the purchase price? It's a rough measure of a property's payback period, based purely on top-line income.
A lower GRM is generally what investors look for, as it suggests a shorter payback period and potentially a better value. A higher GRM means you're paying more for every dollar of rent, and it will take longer for the gross income to cover the purchase price.
The GRM Formula
The formula is about as simple as it gets, which is why it’s the perfect first-pass metric for comparing multiple properties on an apples-to-apples basis.
Gross Rent Multiplier (GRM) = Property Price / Gross Annual Rent
To run this calculation, you only need two pieces of information. Let's break down the inputs.
Quick GRM Calculation Breakdown
| Component | Description | Example |
|---|---|---|
| Property Price | The listing price or market value of the property. The asking price is perfect for initial screening. | $300,000 |
| Gross Annual Rent | The total potential rent you could collect in a year, before any expenses (taxes, insurance, vacancies, etc.). | $30,000 |
It’s a simple ratio that provides a powerful snapshot of value before you commit to a deeper analysis.
A Quick Example
Let’s put this into practice. Say you’re looking at a small duplex listed for $300,000. Each of the two units rents for $1,250 a month.
First, you need the Gross Annual Rent: ($1,250/month per unit) × 2 units × 12 months = $30,000
Now, just plug the numbers into the GRM formula: GRM = $300,000 / $30,000 = 10
This property has a GRM of 10. In theory, it would take about 10 years of collecting gross rent to pay off the purchase price. The principle holds true no matter the asset size; for example, a $5 million multifamily property pulling in $552,000 in gross rents has a GRM of about 9.06. For a deeper dive, you can see how this metric is applied to commercial-scale properties.
With this one number, you can instantly compare this duplex to other deals on the market, helping you filter out overpriced listings and focus your energy on opportunities with real potential.
How to Calculate Gross Rent Multiplier Step by Step
Calculating the Gross Rent Multiplier is a fundamental skill every investor should master. Once you get the hang of it, you’ll be able to quickly size up any potential deal that crosses your desk.
The formula is straightforward, requiring just two pieces of information.
GRM = Property Price / Gross Annual Rent
Let's break down how to find those two numbers and apply them in a real-world scenario.
Step 1: Find the Property Price
First, you need the price of the property. When screening deals, whether on an investor marketplace or from a broker, the asking price is the most practical figure to use. It's right there on the listing.
- For Beginners: Stick with the asking price. It’s the fastest way to screen deals.
- For Experienced Investors: If you're getting serious, you might substitute your own estimated market value based on recent comparable sales (comps). But for initial analysis, the list price is fine.
Step 2: Determine Gross Annual Rent
Next is the property's gross annual rent. This is the total potential rental income over 12 months, before subtracting any expenses like taxes, insurance, or maintenance.
- For Occupied Properties: Simply take the current monthly rent for each unit and multiply by 12.
- For Vacant or Underperforming Units: You’ll need to do some quick homework. Look at comparable rental listings in the immediate area to determine the property's market rent.
This step is crucial. Using below-market rents will give you an artificially high GRM, making a good deal look bad. Conversely, overestimating rent can make a mediocre deal look like a home run. Accuracy here is key.
Step 3: Calculate the GRM with an Example
Let’s put it all together with a small multifamily property. You're analyzing a four-plex listed for $480,000.
You find out two units are rented for $1,300/month each. The other two are vacant, but your research shows they should easily get $1,350/month each.
Calculate Total Monthly Rent: (2 units × $1,300) + (2 units × $1,350) = $2,600 + $2,700 = $5,300
Calculate Gross Annual Rent: $5,300/month × 12 months = $63,600
Calculate the GRM: $480,000 (Property Price) / $63,600 (Gross Annual Rent) = 7.55
The GRM for this four-plex is 7.55. You now have a clean number to instantly compare this property against other deals in your target market.
Using GRM to Estimate a Property's Value
While calculating GRM is great for comparing deals, the real power comes from flipping the formula around. You can use it to determine what a property should be worth, helping you spot undervalued assets and make confident offers.
Here’s the reversed formula:
Estimated Property Value = Market GRM × Gross Annual Rent
This simple equation is a game-changer when evaluating off-market deals or properties in areas with limited public sales data.
Finding a Reliable Market GRM
To make this work, you need a solid "Market GRM"—the typical GRM for similar properties in a specific neighborhood.
Here’s how to find it:
- Analyze Recent Sales: Pull sales records for similar properties sold in the last 6-12 months. Calculate the GRM for each using its sale price and rental income.
- Talk to Pros: Real estate agents, brokers, and property managers in the area are invaluable resources. They often have a strong sense of the going GRM for different asset types.
- Use an Investor Marketplace: On our platform, you can often filter sold properties or view market-level data. A quick review of deals can help you establish a GRM baseline for your target market fast.
After analyzing a handful of comps, you'll see a pattern. For instance, you might find that duplexes in a certain area consistently sell at a GRM between 7.5 and 8.5. That range becomes your benchmark.
Putting It All Together in a Scenario
Let's walk through a real-world example. A wholesaler brings you an off-market duplex with no asking price. It’s up to you to determine what to offer.
You know the property can generate $40,000 in gross annual rent. After researching recent sales and talking to a local agent, you’ve landed on a market GRM of 8 for this type of property.
Now, do the math:
Estimated Value = 8 (Market GRM) × $40,000 (Gross Annual Rent) = $320,000
Just like that, you have a data-backed valuation of $320,000. This becomes the foundation for your offer, giving you the confidence that you’re not just guessing. Savvy investors and wholesalers use this tactic every day to make quick, confident bids. This approach shifts you from a reactive buyer to a proactive investor who can identify—and create—your own opportunities. To learn more, check out our full guide on how to value a commercial property.
What Is a Good Gross Rent Multiplier
So you’ve calculated a GRM. Now what? The real question is whether it's a good one. This is where you shift from simple math to strategic decision-making.
The honest answer? It depends. While a lower GRM is almost always better on paper—meaning a faster payback period—that number doesn't tell the whole story.
As a quick rule of thumb, many investors use these benchmarks to sort through deals:
- Under 8: Often signals a strong potential buy, especially for cash flow.
- 8 to 12: Generally considered a fair or average range in many markets.
- Over 12: May indicate the property is overpriced or that you're buying for appreciation, not immediate cash flow.
However, a "good" GRM is never a one-size-fits-all metric. It’s completely tied to the local market, property type, and your investment strategy.
Market Context Is Everything
A GRM of 15 in a high-growth city like Austin could be a great deal, while a GRM of 9 in a stable Midwest market might be just average. The local economy drives both property values and rental income.
- Low GRM Markets (e.g., 5-8): Typically found in slower-growing, steady cities. These properties tend to offer stronger initial cash flow because prices are more aligned with current rents. If your goal is immediate income, hunt in these markets.
- High GRM Markets (e.g., 12-20+): Common in rapidly appreciating coastal cities or booming tech hubs. Investors here are often playing the long game, willing to pay a premium (and accept a higher GRM) because they’re betting on future growth.
The table below breaks down what different GRM ranges can signal about a potential investment.
GRM Benchmarks and Investor Implications
This table helps interpret GRM values and understand the typical characteristics associated with each range.
| GRM Range | Interpretation | Potential Investor Focus |
|---|---|---|
| Under 8 | Potentially undervalued or in a slower-growth, high cash flow market. | Investors prioritizing immediate, strong monthly cash flow and a faster return of capital. |
| 8 to 12 | Considered average or fairly priced for many stable U.S. markets. | A balanced approach, seeking a mix of reasonable cash flow and potential for moderate appreciation. |
| 12 to 20 | Often found in high-demand, high-growth markets. Suggests a focus on appreciation. | Investors banking on long-term property value increases, often in markets with strong job growth. |
| Over 20 | Typically indicates a luxury property or an investment in a highly speculative market. | "Trophy" property buyers or those making a significant bet on future market expansion. |
Think of these as a starting point. They give you a way to categorize a property, but the real analysis happens when you dig into local market dynamics.
Aligning GRM with Your Investment Strategy
Your personal goals are the ultimate filter for what makes a GRM "good."
For Beginners: Sticking with lower GRM properties (under 10) in stable markets is often a smart move. It prioritizes positive cash flow, which provides a financial cushion while you learn the ropes of being a landlord.
For Experienced Investors: You might strategically target a property with a higher GRM if you believe it's in a market poised for a boom. Your experience allows you to project future rent growth and appreciation that could justify paying a higher price today.
Understanding these benchmarks is crucial when you’re scanning for deals on platforms. For example, recent J.P. Morgan data showed that single-family rentals in the Sun Belt averaged a GRM of 9.5 after market shifts. Knowing that context helps you see if a GRM of 9 is a bargain or just the new normal. For more on these trends, you can explore insights on real estate metrics from J.P. Morgan.
Ultimately, a good GRM is one that matches the property's potential with your own financial goals.
GRM vs. Cap Rate and Other Key Metrics
While the Gross Rent Multiplier is a fantastic tool for a quick gut check, it gets its speed by ignoring one huge piece of the puzzle: expenses. This is its superpower for sorting listings fast, but it's also its biggest blind spot. To truly know if you've found a winner, you have to compare GRM against other core metrics.
The most critical comparison is between GRM and the Capitalization Rate (Cap Rate). They both help answer "Is this property's income good for its price?" but they tell different parts of the story.
- GRM looks at gross rent. It’s a top-line, back-of-the-napkin number that ignores operating costs like taxes, insurance, or maintenance.
- Cap Rate uses Net Operating Income (NOI). To find the NOI, you take your gross rent and subtract all operating expenses. This gives you a much clearer picture of the property’s actual profitability before debt service.
This one difference is everything. It defines when and why you use each metric.
When to Use GRM vs. Cap Rate
Think of these two metrics as a one-two punch for evaluating deals. You use them in order to get the full story.
GRM is for your first pass. Its simplicity is a feature, not a bug. It lets you blaze through dozens of potential deals to see which ones are priced in the right ballpark based on their raw income potential. A low GRM is your signal that "this one might be worth a closer look."
Once a property passes your GRM filter, it's time to calculate the Cap Rate. It takes more work—you have to find or estimate expenses—but it provides a far more honest measure of financial performance. To get a better handle on this next step, check out our guide on how to calculate cap rate.
This chart shows how different GRM ranges can point to different kinds of opportunities, from lower-risk cash flow plays to higher-risk bets on appreciation.
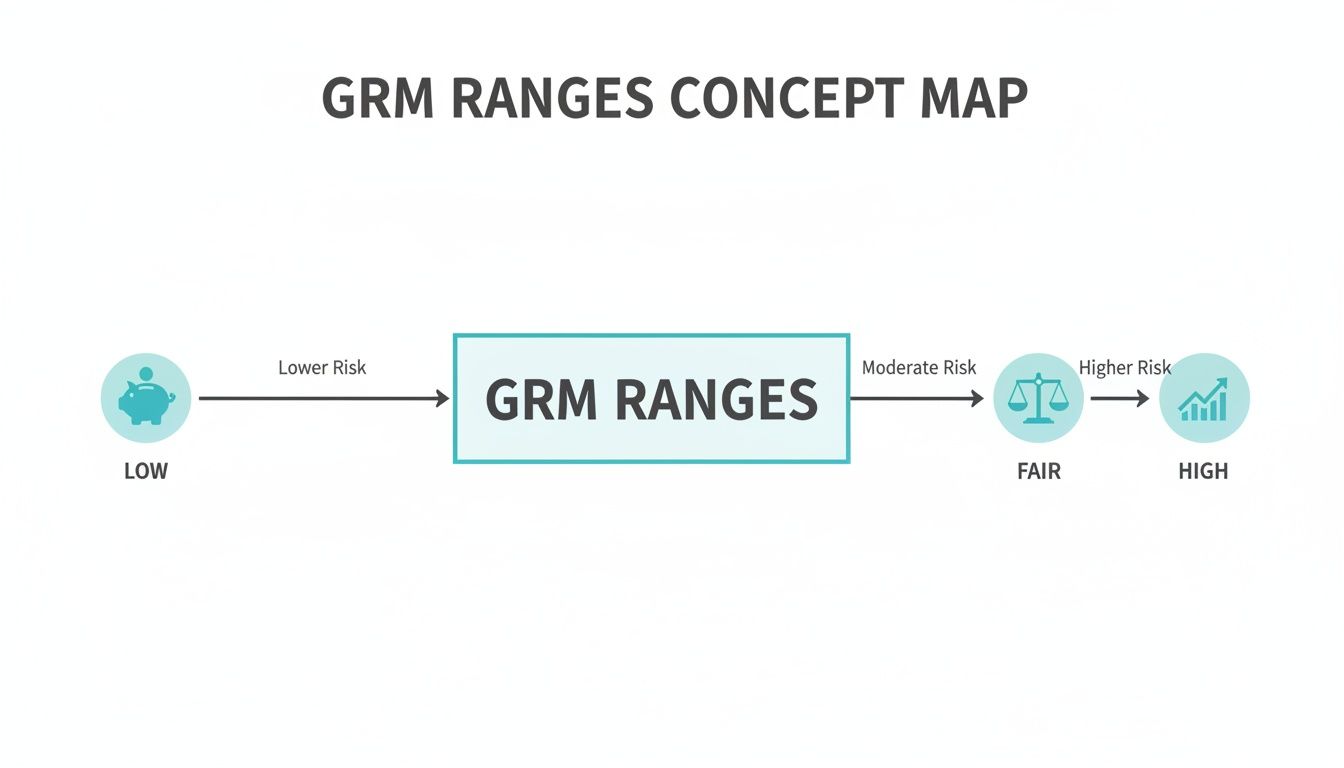
This helps put a property's GRM into context, telling you whether you're looking at something fairly priced, a potential bargain, or a premium-priced property.
Connecting to Cash-on-Cash Return
So, where does the money that actually hits your bank account fit in? That’s where Cash-on-Cash Return comes in. This metric answers the most important question: for every dollar I invest, how many cents do I get back each year?
It measures your annual pre-tax cash flow against the total cash you invested out-of-pocket.
Unlike GRM or Cap Rate, Cash-on-Cash Return is all about your specific deal structure and financing. A property can have a great GRM and a solid Cap Rate but still produce a poor Cash-on-Cash Return if you use unfavorable loan terms. Using all three metrics—GRM, Cap Rate, and Cash-on-Cash Return—gives you a complete toolkit to evaluate any deal from high-level to personal return.
How Our Marketplace Helps You Use GRM

Manually calculating the gross rent multiplier on every single deal is a massive time sink. It’s a bottleneck that guarantees you'll miss good opportunities while you're buried in spreadsheets. This is where an investor marketplace and networking platform completely changes the game.
Instead of being a number-cruncher, you become a decision-maker, focusing only on properties that match your strategy. The platform helps you do this in two key ways: building your buy box and connecting with the right people.
Set Your Criteria and Let the Platform Do the Work
On our marketplace, you can create a detailed investor profile that acts as your "buy box," defining your perfect deal just once. You can plug in target markets, property types, and—most importantly—the exact Gross Rent Multiplier you're looking for.
By setting your target GRM range—say, anything below a 9.0—you tell the system to automatically filter out overpriced deals. What you get back is a curated list of opportunities that align with your strategy, saving you countless hours.
Find and Vet Partners Faster
The network aspect of the platform is just as powerful. Wholesalers and brokers can see your buy box and bring you deals that are a perfect fit, saving them time and getting you better deal flow. You can also quickly vet potential partners by reviewing their profiles, deal history, and reviews from other investors, building trust and credibility before you even start a conversation. This helps you build a reliable team of wholesalers, lenders, and agents to close more deals, faster.
By using the platform to handle sourcing and initial analysis, you can make smarter, faster decisions with more confidence. You can browse deals that fit your investment criteria right now on the marketplace.
Got Questions About GRM? We've Got Answers.
As you start using GRM, a few practical questions almost always come up. Here are answers to some of the most common ones.
Can I Use GRM for Commercial Properties?
You can, but with caution. GRM works best for smaller residential or mixed-use properties where value is tied almost entirely to rental income, like a small retail strip or a building with apartments over a storefront.
For larger, more complex assets like a major shopping center or industrial facility, more robust metrics are needed. The Cap Rate, which accounts for numerous expenses and varied income streams, is a much safer bet. But for simpler commercial deals, GRM remains a great first-pass filter.
What Is the Biggest Limitation of GRM?
The single biggest blind spot of the Gross Rent Multiplier is that it completely ignores operating expenses. It's a top-line metric, so it doesn't account for property taxes, insurance, maintenance, management fees, or vacancies.
Because it ignores costs, a property with a low GRM might look like a bargain but could be an operational nightmare. High expenses can demolish your cash flow. This is precisely why GRM should only be your first look at a deal, never the final word.
Does GRM Differ Between Single-Family and Multifamily?
Yes, and it's a critical difference. Even in the same neighborhood, you'll typically find that multifamily properties have lower GRMs than single-family rentals.
There are a couple of reasons for this:
- Economies of Scale: It's more efficient and cost-effective to manage one 10-unit building than 10 separate single-family homes.
- Diversified Risk: A vacancy in a single-family rental means your income drops to zero. In a multifamily property, one vacancy is a much smaller, more manageable financial hit.
Because of this lower risk and better efficiency, investors are often willing to pay slightly more relative to the gross rent for a multifamily asset, which results in a lower GRM.
Ready to stop wasting time on deals that don't fit your strategy? With an investor marketplace, you can set a buy box with your target GRM and let the platform bring the right opportunities directly to you. Create your free investor profile to get matched with deals that fit your criteria.