
If you're analyzing a real estate deal, you need a quick way to know if it's worth your time. For most standard rental properties, a good cash on cash (CoC) return is generally considered to be between 8% and 12%. This range represents a healthy balance between the annual income a property generates and the actual cash you invested to acquire it.
This guide will walk you through calculating CoC return, setting realistic targets for your strategy, and leveraging technology to find deals that meet your financial goals.
What a Good Cash on Cash Return Really Means
Among the many metrics in real estate, cash on cash (CoC) return is one of the most practical. It’s a gut check for both new and seasoned investors because it answers one simple, powerful question: for every dollar I invest, how much am I getting back each year?
It cuts through noise like a property's total value or loan amount to focus on how hard your personal cash is working for you right now.
That 8% to 12% benchmark is widely respected because it indicates a property is generating healthy cash flow relative to your out-of-pocket costs. Those costs are key—they include your down payment, closing costs, and any immediate repair funds. It’s the real money you put on the line.
While you can use real estate financial templates to model deals, understanding what is a good cash on cash return is vital when evaluating opportunities on a marketplace like the Investor Deal Exchange or anywhere else.
Breaking Down CoC Return Levels
Of course, not all returns tell the same story. A 5% return in a high-growth market might be a great deal, while an 8% return in a riskier area could be a red flag.
To help you quickly analyze a property, here's a cheat sheet for interpreting CoC return benchmarks.
Cash on Cash Return Benchmarks at a Glance
This table gives you a quick reference for what those percentages actually mean when you're analyzing a deal.
| CoC Return Percentage | Performance Level | What It Means for an Investor |
|---|---|---|
| Under 5% | Underperforming | For most cash flow strategies, this is too low. It may signal an overpriced deal or a stable, low-yield market where returns depend on appreciation, not immediate income. |
| 5% to 7% | Acceptable | In highly competitive or high-appreciation areas, this can be a solid return. You’re getting some cash flow while positioning for long-term property value growth. |
| 8% to 12% | Good / Ideal | This is the target for many buy-and-hold investors. It offers strong, reliable cash flow relative to your investment and a healthy cushion for unexpected expenses. |
| Above 12% | Excellent | Returns this high are fantastic but often come with more risk or work. This is common for value-add projects, deals in emerging neighborhoods, or assets requiring more hands-on management. |
Think of these ranges as a guide, not rigid rules. The right cash on cash return for you will always depend on your personal goals, risk tolerance, and the specific market you're investing in.
How to Calculate Your Cash on Cash Return
Running the numbers for your cash on cash (CoC) return is an essential skill for determining if a deal is truly viable. The entire calculation boils down to one straightforward formula that every investor needs to know.
Cash on Cash Return (%) = (Annual Pre-Tax Cash Flow / Total Cash Invested) x 100
This formula provides a clear percentage, making it easy to compare one investment opportunity against another. Let’s break down the two main components.
Nailing Down Your Annual Pre-Tax Cash Flow
First, Annual Pre-Tax Cash Flow is the cash left over after you’ve paid all the property’s bills for the year—including the mortgage—but before income taxes.
To find this, you first need to calculate your Net Operating Income (NOI), which is your total rental income minus all operating expenses (e.g., taxes, insurance, management fees, maintenance). From there, you subtract your annual debt service.
- Annual Debt Service: This is the total amount you pay on your mortgage—both principal and interest—over a full 12-month period.
The calculation is simple: NOI - Annual Debt Service = Annual Pre-Tax Cash Flow.
Pinpointing Your Total Cash Invested
Next is the Total Cash Invested. This is the most crucial part of the equation because it represents every dollar you personally paid out-of-pocket to acquire the property. It’s the "cash" in "cash on cash."
A common mistake for beginners is only counting the down payment. To get a true picture, you must include all out-of-pocket costs.
- Down Payment: The initial capital paid upfront to secure the loan.
- Closing Costs: Fees for the appraisal, loan origination, title insurance, and other services.
- Initial Repair Costs: Any cash spent immediately on renovations to make the property rent-ready, often called the "rehab" budget.
Adding these up gives you your Total Cash Invested.
Putting It All Together: A Quick Example
Let's walk through a realistic scenario for a single-family rental.
Calculate Annual Pre-Tax Cash Flow:
- Annual Gross Rent: $24,000 ($2,000/month)
- Annual Operating Expenses (for NOI): -$9,600
- Annual Debt Service (mortgage): -$8,400
- Annual Pre-Tax Cash Flow: $6,000
Calculate Total Cash Invested:
- Down Payment (20% on a $250,000 property): $50,000
- Closing Costs: $7,500
- Initial Repairs: $2,500
- Total Cash Invested: $60,000
Calculate Cash on Cash Return:
- ($6,000 / $60,000) x 100 = 10% CoC Return
In this example, the property delivers a solid 10% return, placing it right in the ideal 8-12% range. To speed up this process, you can use one of the many free real estate investment calculators available online.
Why Your Investment Strategy Defines a "Good" Return
While the 8-12% range is a great rule of thumb, a truly “good” cash on cash return is personal. It hinges on your strategy, risk appetite, and the market you’re buying in.
Thinking every deal must hit a single number is a common rookie mistake. Different strategies demand different outcomes. Your target CoC should reflect what you're trying to accomplish.
For instance, an investor focused on long-term wealth might accept a lower return on a stable, A-class property, while a house flipper needs a much higher return to justify the short-term risk and effort.
Setting Targets for Cash Flow vs. Appreciation
Your primary goal for a property will completely change how you define a "good" return. Are you hunting for immediate monthly income, or are you betting on the property's value to grow over time?
Strategy 1: Maximizing Cash Flow: If your priority is generating a steady income stream now, you’ll target a higher CoC return. These investors often look for turnkey properties in strong rental markets, where 10% or higher provides a healthy income relative to the cash invested.
Strategy 2: Prioritizing Appreciation: If you're buying in a high-growth market, your focus might shift to appreciation. In that case, a lower CoC of 5-7% could be a fantastic deal. You're trading some immediate cash flow for the potential of significant long-term gains when the property value rises.
For beginners, it's often wise to focus on a balanced approach that provides some cash flow while still being in a decent area. For experienced investors, you might be more comfortable accepting a lower initial return in a prime location, confident in your ability to manage the asset for long-term growth.
How Different Investment Types Impact Your CoC Goals
The type of deal you're chasing is just as important as the market. An intense, hands-on project must deliver a much higher return to make the extra work and risk worthwhile.
Consider the different CoC targets for these common strategies:
BRRRR Method: An investor using the BRRRR (Buy, Rehab, Rent, Refinance, Repeat) method takes on significant risk and effort. A successful BRRRR investor often targets a CoC return of 20% or more after the refinance. Some even achieve an "infinite return" if they pull all of their original cash back out.
Turnkey Rentals: Someone buying a fully renovated, tenant-occupied turnkey property is paying for convenience and stability. The risk is lower, and management is minimal. For that peace of mind, a return in the 8-10% range is often considered a great find.
Small Multifamily: Buying a duplex or fourplex often creates economies of scale that can boost returns. It's common for investors on our platform to filter specifically for small multifamily deals that can generate a CoC of 10-15%.
At the end of the day, knowing what is a good cash on cash return really means knowing your own playbook first. It’s about setting a personal benchmark that aligns with your financial goals and the amount of risk and effort you’re willing to invest.
Understanding CoC vs Cap Rate vs ROI
When you're analyzing a potential deal, you get hit with a blizzard of acronyms. But in the world of real estate investing, three metrics really do the heavy lifting: Cash-on-Cash (CoC) Return, Cap Rate, and Total Return on Investment (ROI).
Mixing these up is a classic rookie mistake. Think of them as tools in your workshop—each is built for a different job. Knowing which one to use is what separates a sharp investor from a confused one.
CoC Return: The "How's It Working for Me?" Metric
As we've discussed, Cash-on-Cash Return is the most personal metric. It’s all about your wallet. It directly compares the cash flow you receive each year to the actual cash you put into the deal.
This makes it the perfect tool for deciding between properties when you're using different financing. It answers one crucial question: "For every dollar I pull out of my bank account, how many cents am I getting back this year?"
Cap Rate: The "How Good Is the Property?" Metric
Cap Rate, on the other hand, ignores you and your loan. It’s focused purely on the property itself. It measures a building’s raw earning power by comparing its Net Operating Income (NOI) to its price, completely stripped of any financing.
This allows for a true apples-to-apples comparison between properties. Cap Rate answers the question: "How profitable is this asset on its own, before any mortgages get involved?" It’s the best way to judge a property’s fundamental strength within its market. Our guide on how to calculate cap rate breaks it all down.
This is where your overall strategy comes into play. Are you hunting for immediate cash flow, or are you playing the long game for appreciation? The answer will determine which metric you lean on most.
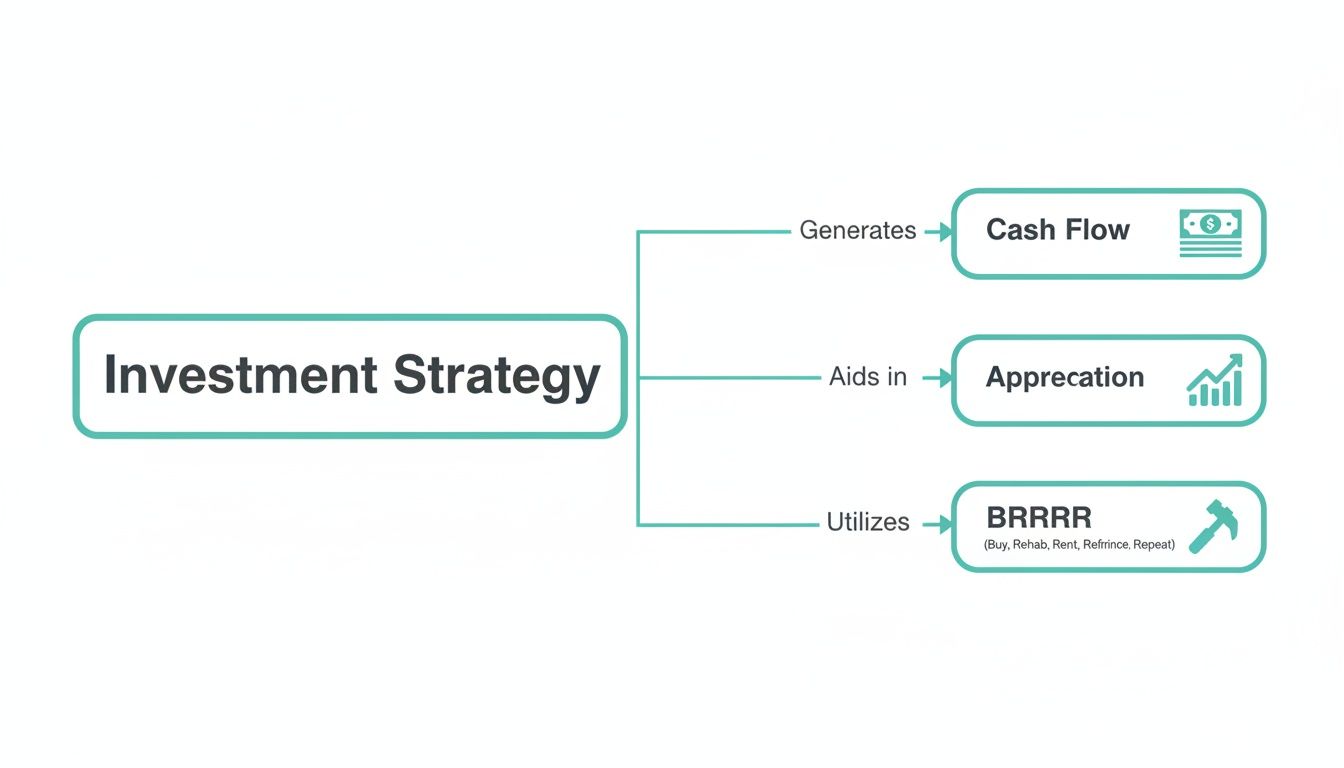
As you can see, while cash flow is a huge piece of the puzzle, it fits into a larger picture that includes things like appreciation and powerful strategies like the BRRRR method.
Total ROI: The "What's the Grand Total?" Metric
Finally, there’s Total ROI. This is the big-picture metric that tells you the full story of your investment over its entire life. It looks beyond first-year cash flow to measure your total profit from start to finish.
Total ROI accounts for everything: the cash flow you collected, the equity you built as the loan was paid down, the appreciation in the property’s value, and even tax benefits. It answers the ultimate question: "When I eventually sell this thing, how much will I have really made?"
While more complex to forecast, Total ROI provides the most complete picture of how an asset builds wealth over time.
CoC vs Cap Rate vs Total ROI Key Differences
To make this crystal clear, let's put these three metrics side-by-side. Each one gives you a different piece of the story, and you need all three to see the whole picture before you pull the trigger on a deal.
The table below breaks down what each metric measures, when to use it, and whether it factors in your loan.
| Metric | What It Measures | Best Used For | Includes Financing |
|---|---|---|---|
| Cash on Cash Return | The annual return on your actual cash invested. | Comparing your personal return on deals with different financing. | Yes |
| Cap Rate | The property's unleveraged annual return based on its price. | Comparing the raw profitability of different properties and markets. | No |
| Total ROI | The overall return across the entire life of the investment. | Evaluating an asset’s long-term wealth-building potential. | Yes |
Understanding these distinctions isn't just academic—it's fundamental to spotting good deals and avoiding bad ones.
Finding High Cash on Cash Return Deals on Our Platform

Knowing your target CoC is one thing; actually finding deals that hit your number is where the real work begins. A dedicated investor marketplace is an essential tool for turning theory into actionable opportunities.
Instead of drowning in listings that don't meet your goals, you can zero in on properties that match your financial criteria from the start. The key is to get strategic and let technology do the heavy lifting, ensuring you only see deals with genuine potential.
Use a Smart Buy Box to Filter for Performance
On our platform, this all starts with setting up your Smart Buy Box. Think of it as your personal deal-finding assistant, working 24/7. You can set precise filters not just for location and property type, but for the financial metrics that drive your returns—including your minimum acceptable cash on cash return.
For example, you can set your buy box to show you only duplexes and triplexes that project a minimum 10% CoC return. This automatically weeds out underperforming assets and fills your pipeline with properties that already meet your baseline for a "good" investment.
Here's how to dial in your criteria to find high-performing deals:
- Set a minimum CoC return: Tell the system to ignore anything below your target, whether it's 8% or 12%.
- Filter by Cap Rate: Add a minimum Cap Rate to find fundamentally solid properties in any given market.
- Define your property type: Focus only on single-family, multifamily, or whatever fits your strategy.
- Specify your geographic area: Target the specific states, counties, or zip codes where you want to build your portfolio.
This filtering means every deal notification you get is relevant and worth your time. You can learn more by exploring our guide to browsing investment properties on the platform.
Run the Numbers With Built-In Deal Calculators
Once you find a promising property, the next step is verifying the numbers—quickly and accurately. Manually building a spreadsheet for every single deal is slow and prone to error.
Our marketplace solves this by integrating deal analysis calculators directly into every listing. Instead of fumbling with spreadsheets while the competition writes an offer, you can see a property’s projected CoC, Cap Rate, and other critical metrics calculated automatically. This empowers you to make faster, smarter decisions and submit offers with confidence.
Answering Your Top Questions About Cash on Cash Return
Once you master calculating cash on cash return, new questions often arise. This is where we move from running numbers to understanding what they mean for your strategy.
Let's address some of the most common questions we hear from investors on our platform.
Does Cash on Cash Return Change Over Time?
Absolutely. Your initial cash on cash return is a snapshot, not a permanent figure. Think of it as the property's performance in year one; it will change as you hold the asset.
Your CoC return will naturally climb as you strategically raise rents, boosting cash flow against the same initial investment. Conversely, a large, unexpected expense like a new roof or a sudden jump in property taxes can pull that number down temporarily.
A major financial move, like a cash-out refinance, completely resets your calculation. A refi pulls capital out for your next deal but also changes the "Total Cash Invested" denominator in your formula, creating a brand new CoC return for the property.
Is a Negative Cash on Cash Return Ever Acceptable?
It can be, but this is a high-risk strategy best left to experienced investors. A negative CoC return means you’re feeding the property money out-of-pocket each month. For most buy-and-hold investors, that’s an immediate deal-breaker.
However, a sophisticated investor might tolerate a small negative return on a property in a rapidly appreciating neighborhood. They are making a calculated bet that the long-term gain in property value will far outweigh the short-term cash loss. This is a speculative approach and not recommended for those who need positive cash flow from day one.
Is a Higher Cash on Cash Return Always Better?
Not always. An eye-poppingly high CoC return—think 20% or more—should make you pause and ask, "What's the catch?" It often signals a trade-off in risk or effort.
A sky-high return could indicate:
- Location Risk: The property might be in a declining area with high tenant turnover and vacancy rates.
- Property Condition: The deal might look great on paper but require a mountain of expensive repairs that could destroy your budget.
- Management Intensity: A high-return property is rarely passive. It might demand a huge amount of your time and energy to remain stable.
For many investors, a steady 9% CoC from a turnkey property in a solid B-class neighborhood is far "better" than a chaotic 25% that requires constant management. The right return is the one that fits your goals, risk tolerance, and desired level of involvement.
Ready to find deals that match your specific investment goals? At Investor Deal Exchange, our Smart Buy Boxes and instant deal calculators help you pinpoint properties that deliver the returns you need.
Create your free investor profile to get matched with deals that fit your criteria.