Sizing up a multifamily deal quickly is crucial, and the cap rate is the fastest way to check its financial pulse. If you're trying to figure out what is a good cap rate for multifamily, most investors target a range between 5% and 8%. This signals a healthy balance between risk and return, but it's not a one-size-fits-all rule. The ideal cap rate shifts based on a property's location, condition, and your personal investment strategy.
This guide provides a practical framework for both new and experienced investors. We'll break down what the numbers mean, what drives them, and how to use cap rates to find deals that match your goals.
What is a Good Cap Rate for Multifamily Properties?
Think of a cap rate as an unfiltered snapshot of a property's earning power before factoring in a loan. It provides a clean way to compare different opportunities, helping you quickly decide if a deal is worth a deeper look.
For those new to the term, a capitalization rate (cap rate) is the expected annual return on a real estate investment, assuming you paid all cash. It’s a foundational metric for deal analysis.
Making Sense of the Numbers: Risk vs. Return
A lower cap rate, typically in the 4-5% range, points to a lower-risk asset. You’ll find these on newer, fully-occupied buildings in prime neighborhoods. The trade-off is that the potential returns are generally lower.
On the other hand, a higher cap rate—say, 8% or more—suggests higher risk but also the potential for a much higher return. These properties might be older, located in transitioning areas, or require significant hands-on management to reach their full potential.
In the U.S. multifamily market, the sweet spot for a balanced risk-reward profile tends to be in the 5.5% to 8% range. This benchmark has evolved; after hitting historic lows in 2021, cap rates rose as the market adjusted to higher borrowing costs, with the national average nearing 6% by 2023. You can see more data on these market shifts in recent multifamily property analyses.
The chart below breaks down these general risk categories, giving you a simple framework for your initial analysis.
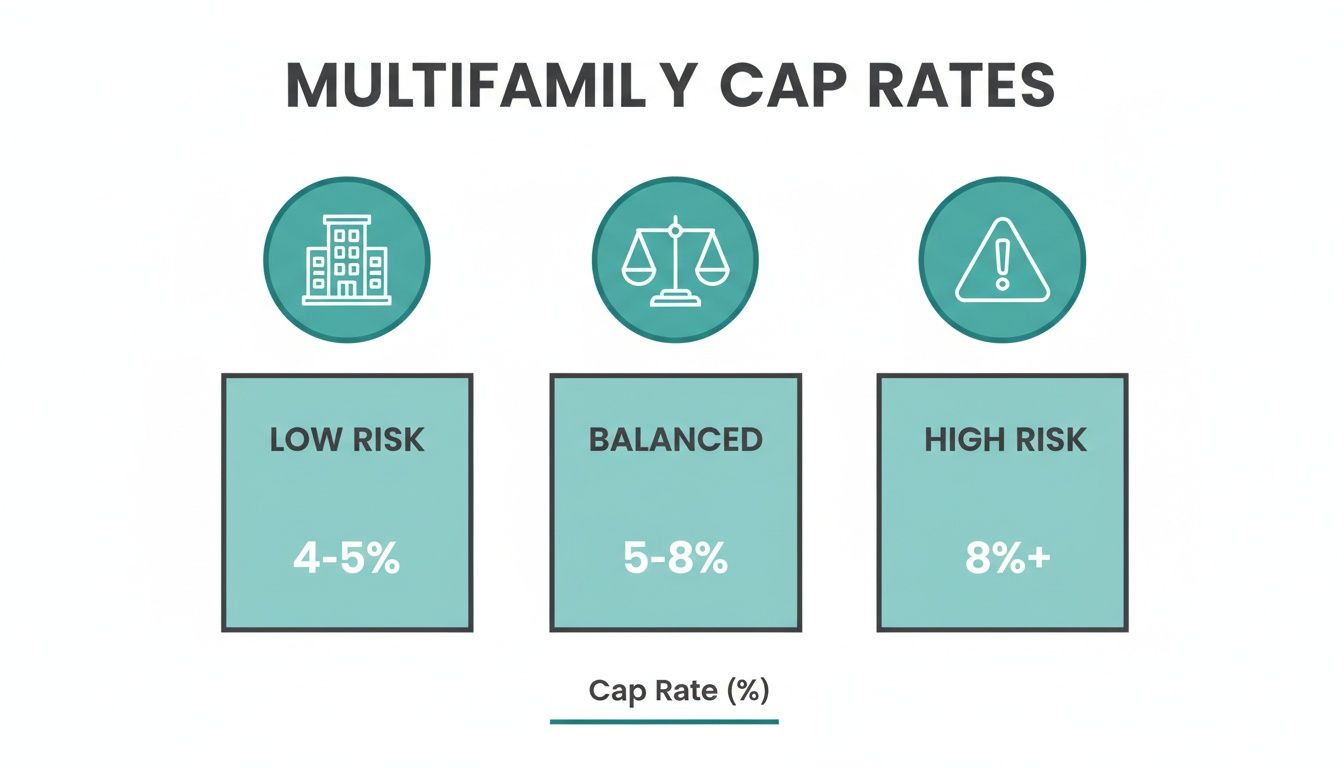
As you can see, the "balanced" 5-8% range is where many investors feel they get a comfortable mix of stability and upside. Understanding where a property falls on this spectrum is the first step to ensuring it aligns with your investment goals.
Typical Multifamily Cap Rate Ranges by Market and Class
The "right" cap rate changes dramatically based on property type and location. A new luxury high-rise in San Francisco will trade at a very different cap rate than an older workforce housing complex in a smaller Midwest city.
This table provides a quick cheat sheet for typical cap rate ranges across different property classes and market tiers.
| Property Class | Primary Market (e.g., NYC, SF) | Secondary Market (e.g., Atlanta, Phoenix) | Tertiary Market (e.g., Smaller Cities) |
|---|---|---|---|
| Class A | 4.0% – 5.5% | 4.5% – 6.0% | 5.0% – 6.5% |
| Class B | 5.0% – 6.5% | 5.5% – 7.0% | 6.0% – 8.0% |
| Class C | 6.0% – 7.5% | 6.5% – 8.5% | 7.5% – 10.0%+ |
Use this as a starting point. If you see a Class A property in Phoenix marketed at an 8% cap rate, it should raise a red flag—either the numbers are too good to be true, or a serious problem is hiding under the surface. This is how you begin to develop a feel for what makes sense in a given market.
Decoding the Cap Rate Formula

Before judging if a cap rate is “good,” you must understand what the number represents. The formula itself is straightforward:
Cap Rate = Net Operating Income (NOI) / Property Value
This equation is powerful because it lets you quickly compare the relative value of different properties. A building that generates a high NOI compared to its price will have a higher cap rate, signaling a stronger potential return.
The Foundation of the Formula: Net Operating Income (NOI)
The most critical piece of this puzzle is the Net Operating Income (NOI). An inaccurate NOI makes your entire cap rate calculation useless. Seasoned investors know that a reliable NOI is the bedrock of any solid deal analysis.
Simply put, NOI is a property’s total income minus all its operating expenses. It’s the cash left over before accounting for mortgage payments or income taxes.
Here’s a quick breakdown of the components:
- Gross Potential Income: The total rent you’d collect if every unit was occupied all year.
- Vacancy & Credit Loss: A realistic deduction for empty units and tenants who don't pay.
- Other Income: Extra revenue from sources like laundry, parking, or storage fees.
- Operating Expenses: All necessary costs, including taxes, insurance, management fees, utilities, and routine maintenance.
Crucially, do not include mortgage payments, major capital improvements (like a new roof), or depreciation in your operating expenses. Those are considered in a more detailed cash flow analysis.
Putting It All Together: A Practical Example
Let's walk through a hypothetical 10-unit apartment building with a $1,500,000 price tag. To determine if it has a good cap rate, we first need to calculate its NOI.
Step 1: Calculate Effective Gross Income (EGI)
- Gross Potential Rent (10 units x $1,200/month x 12 months) = $144,000
- Vacancy Loss (5% of Gross Rent) = -$7,200
- Other Income (laundry) = +$3,200
- Effective Gross Income = $140,000
Step 2: Calculate Total Operating Expenses
- Property Taxes = $15,000
- Insurance = $5,000
- Property Management (8% of EGI) = $11,200
- Utilities (common areas) = $4,800
- Repairs & Maintenance = $6,000
- Total Operating Expenses = $42,000
Step 3: Calculate Net Operating Income (NOI)
- Effective Gross Income - Total Operating Expenses
- $140,000 - $42,000 = $98,000 (NOI)
Now, we plug the NOI and property value into our formula. For a closer look, check out our guide on how to calculate cap rate.
Cap Rate = $98,000 / $1,500,000 = 0.0653 or 6.53%
That 6.53% cap rate gives you a clean, standardized metric to confidently compare this deal against any other property on the market.
What Really Drives Multifamily Cap Rates
A cap rate isn't just a number; it tells a story about a property's risk, location, and future potential. A 5% cap rate on a new building in a booming tech hub signals stability and high investor demand. An 8% cap rate on an older complex in a town with a shaky job market hints at higher risk and the need for active management.
To truly know what is a good cap rate for multifamily, you must learn to read the story behind the number. Several key factors shape whether investors will pay more (driving cap rates down) or less (pushing cap rates up) for an income stream.
Location and Market Health
The real estate mantra—location, location, location—is the biggest driver of cap rates. A property’s address dictates its access to jobs, schools, and amenities, which directly impacts tenant demand and rental growth potential.
Primary markets like New York City or San Francisco are seen as lower risk due to diverse economies and deep tenant pools. High demand and perceived safety lead investors to accept lower returns, compressing cap rates.
Conversely, smaller tertiary markets can be more volatile. The risk of a major employer leaving town is higher, so investors demand a bigger potential payday to compensate, which pushes cap rates higher.
Property Class and Condition
The building's quality and condition also play a massive role. Properties are generally sorted into three classes, each with its own risk profile and typical cap rate range.
- Class A Properties: New, high-end buildings in the best locations. They command the highest rents from stable tenants, making them low-risk investments that trade at the lowest cap rates.
- Class B Properties: Well-maintained but older properties. They offer a great balance of steady cash flow and value-add potential, placing their cap rates in a moderate range.
- Class C Properties: Buildings typically over 20 years old, often in less desirable areas. They require significant capital for repairs and active management, so investors demand the highest cap rates to justify the effort.
Any experienced investor will tell you that deferred maintenance is a huge red flag that screams "risk" and justifies a higher cap rate.
Economic Climate and Interest Rates
The broader economy, especially interest rates, sets the stage for every deal. When the Federal Reserve hikes rates, borrowing becomes more expensive for investors.
To achieve their target returns with pricier debt, buyers must pay less for a property relative to its income. This pressure pushes property values down and cap rates up. When interest rates fall, the opposite occurs: cheaper money allows investors to bid prices up, compressing cap rates.
A property's cap rate is a direct reflection of the market's perception of risk. Every factor, from the local job market to the building's plumbing, is priced into this single metric.
Historical data often points to multifamily cap rates between 5.3% and 5.7% as a reliable benchmark. Some models suggest market fundamentals could support a cap rate closer to 5.1%, but the market has hovered around 5.7%. This gap suggests factors like interest rate uncertainty are keeping cap rates slightly inflated, signaling that valuations could improve once the market stabilizes. You can discover insights into future cap rate movements to see what experts are predicting.
Understanding these drivers allows you to move beyond a surface-level number and judge whether a cap rate truly reflects a property's risk and if the potential reward fits your strategy.
Putting Cap Rates to Work in Your Deal Analysis

Relying solely on a property's cap rate is like driving with only a speedometer. It tells you your current speed but nothing about the road ahead. The cap rate is a vital tool for quick, apples-to-apples comparisons, but it doesn't give you the whole picture.
Its strength is also its weakness: it strips out financing to give a pure look at unleveraged return potential. But real-world investing almost always involves a loan. To make a smart decision, you must use the cap rate as one instrument on a full analysis dashboard.
Beyond the Cap Rate: The Metrics That Really Matter
Chasing the highest cap rate is a classic rookie mistake. A deal with a higher cap rate isn't automatically better once you introduce a mortgage. To get the complete story, pair your cap rate analysis with these key metrics:
- Cash-on-Cash Return: This answers the most important question: "For every dollar I invest, how much cash do I get back each year?" It measures the annual pre-tax cash flow against your total initial cash investment.
- Internal Rate of Return (IRR): This is the long-game metric. It calculates the total annualized return over the entire investment holding period, factoring in your initial cash, all cash flow received, and the final profit from the sale.
A property with a lower cap rate might produce a stronger cash-on-cash return if you can secure favorable financing. For a more detailed walkthrough, our article on how to value a commercial property offers a deeper dive.
A Tale of Two Properties: A Practical Case Study
Let's compare two multifamily deals. At first glance, Property B's higher cap rate makes it seem like the clear winner.
Property A: The Stable Performer
- Purchase Price: $2,000,000
- Net Operating Income (NOI): $110,000
- Cap Rate: 5.5%
Property B: The "High Return" Play
- Purchase Price: $1,500,000
- Net Operating Income (NOI): $105,000
- Cap Rate: 7.0%
An investor focused only on cap rates would jump on Property B. But watch what happens when we apply the same financing terms: a 25% down payment and an annual mortgage payment of $80,000.
Calculating the Real Returns
Now, let's run the numbers for cash-on-cash return.
Analysis for Property A (5.5% Cap Rate):
- Cash Invested (25% Down): $500,000
- NOI: $110,000
- Annual Mortgage Payment: -$80,000
- Annual Pre-Tax Cash Flow: $30,000
- Cash-on-Cash Return: ($30,000 / $500,000) = 6.0%
Analysis for Property B (7.0% Cap Rate):
- Cash Invested (25% Down): $375,000
- NOI: $105,000
- Annual Mortgage Payment: -$80,000
- Annual Pre-Tax Cash Flow: $25,000
- Cash-on-Cash Return: ($25,000 / $375,000) = 6.67%
In this scenario, Property B still comes out ahead on cash-on-cash return, but the gap is much smaller than the cap rates suggested. If Property A is in a better neighborhood with stronger rent growth potential, its long-term total return (IRR) could easily surpass Property B's.
The cap rate is your starting point, not your finish line. A truly good deal is one where the cap rate, cash-on-cash return, and long-term growth potential all align with your specific investment strategy.
This example proves a vital lesson: never fall in love with a high cap rate alone. The best investors use the cap rate to quickly filter opportunities, then immediately pivot to a deeper analysis of cash flow and total return based on their unique goals.
Using a Marketplace to Find Deals That Match Your Criteria
Knowing your target cap rate is one thing; finding properties that hit that number is another. Sifting through random listings and manually running numbers is a massive time-sink. This is where an investor marketplace changes the game, turning a frustrating hunt into a focused, data-driven workflow.
On our platform, investors can cut through the noise and zero in on opportunities that align with their investment strategy. This provides a serious advantage in a crowded market, helping you find and analyze deals faster.
Setting Up Your Smart Buy Box
The key is creating a Smart Buy Box—your personalized deal-finding engine. You define your ideal multifamily investment, and the system automatically brings matching deals straight to you.
You can set detailed filters that go far beyond location:
- Target Cap Rate Range: Dial in your ideal return, like 5.5% to 7.5%, to instantly filter out properties that don't make financial sense.
- Property Type & Size: Specify whether you're looking for a duplex, a fourplex, or a larger apartment building.
- Financial Metrics: Set a minimum NOI or a target cash-on-cash return to ensure every deal meets your cash flow goals.
- Value-Add Potential: Search for specific opportunities, like properties with below-market rents that signal a clear path to boosting future income.
This precise filtering means every property that hits your inbox has already passed your initial screen, saving you countless hours.
Analyzing Deals Instantly with Built-in Tools
Once a property matches your buy box, you can analyze it immediately. One of the biggest advantages of using an investor-focused marketplace is having financial calculators built right into the listings.
With just a click, you can get an instant read on a property’s:
- Cap Rate: Calculated for you based on the financials provided.
- Cash-on-Cash Return: Plug in your financing assumptions to see what your actual leveraged return could look like.
- Potential ROI: Run different scenarios to project future returns based on rent growth and appreciation.
This instant feedback loop lets you quickly compare multiple properties and move decisively when the right opportunity appears. To see how this works, you can browse the marketplace and explore the features on active listings.
Building Your Personal Multifamily Cap Rate Strategy
 There is no single “good” cap rate that works for every investor. The right target depends on your personal strategy, risk tolerance, and long-term financial goals.
So, when you ask what is a good cap rate for multifamily, the first question to answer is: what does a good investment look like to you? Are you seeking stable, hands-off buildings for predictable cash flow? Or are you a value-add investor looking to force appreciation and chase a higher total return?
Define Your Investment Thesis
Before looking at deals, get crystal clear on your primary objective. This will be the bedrock of your strategy.
- For Beginners: Your goal might be simplicity and stability. A lower-risk, lower-cap-rate property, like a solid Class B building, can provide steady cash flow while you learn the ropes.
- For Experienced Investors: If you have capital for renovations, a higher-cap-rate Class C property could be a perfect fit. The goal isn't just the day-one return; it's the value you create by improving the asset.
Develop Your Deal-Screening Checklist
Use a consistent framework to filter every opportunity. This makes it easier to compare deals on an apples-to-apples basis.
Your personal cap rate strategy is your filter. It allows you to quickly discard 95% of opportunities and focus your energy on the 5% that can actually move you toward your goals.
Use these questions as a gut-check for any multifamily deal:
- Does the Cap Rate Match My Risk Tolerance? Does the property’s class, age, and location align with the risk I'm willing to accept?
- Is There a Clear Path to Increase NOI? Can I realistically raise rents, reduce expenses, or add new income streams?
- How Does It Compare to the Local Market? Is this cap rate competitive with similar properties in the same submarket?
- What Does the Full Analysis Show? Beyond the cap rate, does the cash-on-cash return meet my targets with my own financing assumptions?
By building this personal framework, you transform the cap rate from a simple number into a strategic tool for finding deals that support your unique vision for building wealth.
Your Top Cap Rate Questions, Answered
As you gain experience, a few common questions about multifamily cap rates will arise. Getting clear answers is key to becoming a confident analyst.
Can a Cap Rate Be Too High?
Absolutely. An unusually high cap rate—think 10% or more—is often a warning sign, not a jackpot. It rarely signals a hidden gem; more often, it points to a hidden risk.
An inflated cap rate could be a red flag for:
- A Declining Market: The property might be in an area losing jobs or residents.
- Massive Deferred Maintenance: You could be facing huge capital expenditures for a failing roof or foundation.
- Unstable Tenants: The rent roll could be propped up by tenants with a spotty payment history.
- Fuzzy Math: A seller might be presenting overly optimistic income projections or understating real operating expenses.
A high cap rate is a clear signal to slow down and perform extra due diligence.
How Do Interest Rates Affect Multifamily Cap Rates?
Interest rates and cap rates have a direct relationship—they tend to move in the same direction.
When the Federal Reserve hikes interest rates, loans become more expensive. To achieve their target returns with a pricier mortgage, investors must pay less for a property relative to its income. This downward pressure on values pushes cap rates up.
Conversely, when interest rates fall, cheaper financing allows investors to bid more for the same NOI. This drives property values up and compresses (lowers) cap rates. Savvy investors always keep one eye on the deal and the other on macroeconomic trends.
Should I Use the Asking Price or My Offer Price to Calculate Cap Rate?
The best practice is to use both at different stages of your analysis.
First, use the seller’s asking price to calculate the "listing cap rate." This is your quick screening tool to see if the property is in the ballpark of your criteria.
However, the calculation that truly matters is the "purchase cap rate." This is based on two inputs you control: the price you plan to offer and your own carefully verified NOI figures—never the seller's. This number reflects your true potential return and should be the foundation of your final investment decision. Always trust your own numbers.
Stop hunting and start finding deals that fit your strategy. On our marketplace, you can set up a Smart Buy Box with your exact cap rate criteria to get matched with multifamily properties that meet your numbers. Create your free investor profile today to see how it works.