Figuring out if a rental property is a real winner or a financial drain comes down to one core task: you must accurately calculate rental income. The key metric you're solving for is Net Operating Income (NOI)—your property's total income after subtracting all its operating expenses. Mastering this calculation is the most critical step to understanding an investment's true financial health.
NOI shows you how much cash the asset itself generates before factoring in any loan payments. This gives you a crystal-clear picture of its raw profitability, allowing you to confidently analyze deals, secure financing, and build a successful portfolio.
The Core Metrics for Analyzing Rental Income
Before firing up a spreadsheet, every investor—from beginner to seasoned pro—needs a firm grasp of the fundamental metrics used to analyze a rental property. Mastering these concepts separates profitable investments from costly mistakes, whether you're evaluating your first duplex or your fiftieth.
This is the high-level dashboard for your property's financial performance.
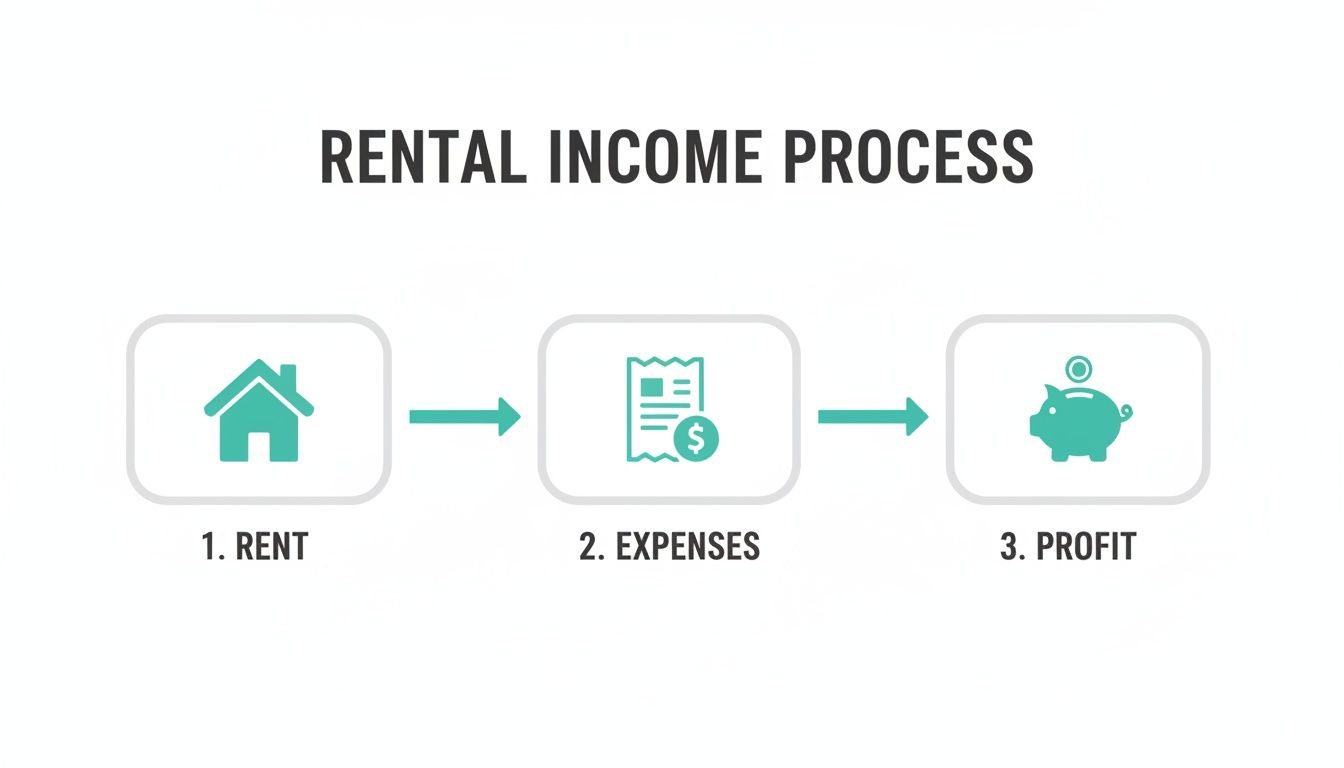
As the chart shows, profit is what remains after you've paid all property-related bills from the rent you've collected.
The Four Pillars of Rental Income Analysis
A proper rental income calculation is built on four essential terms that layer on top of each other. Getting these right is the backbone of any solid deal analysis.
Gross Potential Rent (GPR): This is the absolute maximum income a property could generate if every single unit was occupied 100% of the time with all tenants paying full market rent. It's your starting point—the ideal, best-case scenario.
Effective Gross Income (EGI): This is where realism kicks in. EGI is your GPR minus the real-world losses from vacancies and any concessions you offer, like a free month's rent to attract a quality tenant. It’s what you can realistically expect to collect.
Operating Expenses (OpEx): These are all the day-to-day costs of keeping the property running. Think property taxes, insurance, repairs, utilities, and management fees. Critically, OpEx does not include your mortgage payment (that's a financing cost, not an operating one).
Net Operating Income (NOI): This is the most important figure. It's your EGI minus all your operating expenses. NOI tells you exactly how much profit the property itself generates, completely independent of your financing structure.
Here's a quick table to help these key terms stick.
Key Metrics in Rental Income Calculation
This is a quick summary of the essential terms and their roles in determining a property's financial performance.
| Metric | What It Measures | Simple Formula |
|---|---|---|
| Gross Potential Rent | The total possible rental income if the property were 100% occupied. | Market Rent per Unit x Number of Units |
| Effective Gross Income | The realistic rental income after accounting for vacancies and concessions. | GPR - Vacancy & Concession Losses |
| Operating Expenses | The day-to-day costs of running the property, excluding debt service. | Sum of All Operating Costs |
| Net Operating Income | The property's pure profit before mortgage payments and income taxes are paid. | EGI - Operating Expenses |
Once you've got these four pillars down, you can analyze deals with confidence, knowing you're looking at the right numbers.
For Beginners: Think of it like this: GPR is your potential salary. EGI is what you actually take home after unpaid time off. NOI is what you have left after paying all your bills—except your car loan. Understanding these core metrics is fundamental, and you can see how they apply across different asset types in our guide on how to value a commercial property.
From Market Rent to Your Realistic Income

Your journey to nailing down a property’s real income potential always starts with an optimistic, but necessary, number: Gross Potential Rent (GPR).
Think of GPR as the absolute best-case scenario. It’s the total annual income your property would bring in if every unit was rented every single day of the year at full market value. It's the first block you lay when building a solid financial projection, but it’s just the starting line.
To get your GPR, you need to research "comps," or comparable properties, in the immediate area. Don't just guess. Look for active listings for similar properties—same bed/bath count, square footage, and condition—to see what the market is actually paying.
Let's say you're analyzing a duplex where similar units next door are renting for $1,500 a month. Your GPR calculation is simple:
$1,500/month x 2 units x 12 months = $36,000
This $36,000 is your Gross Potential Rent. It’s a great number to have, but any investor who’s been around the block knows that 100% occupancy is a fantasy.
Adjusting for Real-World Conditions
The real skill in underwriting a deal is moving from that perfect-world GPR to a much more practical figure: Effective Gross Income (EGI). This number reflects what you can actually expect to collect after accounting for the inevitable bumps in the road.
EGI is what’s left after you subtract losses from two key areas:
- Vacancy: This is the time when a unit is sitting empty between tenants. No tenant means no rent check.
- Concessions: These are the incentives you might offer to attract or keep tenants, like "one month free" on a 12-month lease or a reduced security deposit.
Key Takeaway: Never, ever skip the step of converting GPR to EGI. Assuming you'll have a tenant paying full rent every single day of the year is one of the most common and costly mistakes new investors make. Building in a conservative buffer for vacancy is what protects your cash flow when reality hits.
Setting Your Vacancy and Concession Rates
So, how do you estimate these losses? A solid rule of thumb is to plug in a vacancy rate of 5% to 8% of your GPR. If the local market is red-hot with a line of tenants out the door, you might lean toward the lower end. In a softer market, a higher rate is the smarter, safer bet.
Using our duplex example with its $36,000 GPR, a conservative 8% vacancy rate means subtracting $2,880 right off the top.
Even if you don't plan on offering concessions, it's wise to budget a small amount—maybe 1-2%—for the unexpected. Let's add another $360 (1%) for potential concessions just to be safe.
Here’s how we get to our realistic income:
$36,000 (GPR) - $2,880 (8% Vacancy) - $360 (1% Concessions) = $32,760 (EGI)
This $32,760 is your Effective Gross Income. It’s the realistic top-line revenue you’ll use for the next steps in your analysis. This disciplined approach ensures your projections are grounded in reality, not just wishful thinking.
Calculating Net Operating Income: Your True Profit Engine
This is where your analysis gets serious. While Effective Gross Income (EGI) gives you a realistic look at your revenue, Net Operating Income (NOI) is what reveals a property's true profitability.
NOI is arguably the single most important metric for judging a rental's performance before your mortgage ever enters the picture.
To find your NOI, you simply subtract all Operating Expenses (OpEx) from your EGI. These are the necessary, ongoing costs to keep the property running and the rent checks coming in. Miss just one of these, and a deal that looks great on paper can quickly turn into a money pit.
The Two Buckets of Operating Expenses
Operating expenses generally fall into two categories. You have to account for both, or your numbers will be way off.
- Fixed Expenses: These costs stay pretty much the same whether the property is full or empty. They're predictable and easy to budget for. Think property taxes, landlord insurance, and any HOA fees.
- Variable Expenses: These are the costs that go up and down based on usage, season, or just plain bad luck. They require a bit more homework to estimate accurately. This bucket includes repairs and maintenance, utilities (if you're paying them), property management fees, and landscaping.
Here’s a critical point that trips up many new investors: your mortgage payment (principal and interest) is not an operating expense. That's a financing cost. NOI measures the health of the asset itself, completely separate from how you choose to finance it.
Don't Guess—Build a Real Expense Budget
It’s tempting to use shortcuts, but building a detailed, line-item budget is what separates pros from amateurs. Getting your rental income calculation right means digging into the real numbers.
For a quick first pass on a property, the "50% Rule" can be a decent screening tool. It's a rough guideline suggesting that operating expenses will eat up about 50% of your gross income. So, if a property rents for $2,000 a month, you'd pencil in $1,000 for OpEx. But to be clear: this is just for a gut check. Never make a final decision based on this.
For Experienced Investors: The 50% Rule is far too blunt for serious analysis. You need to build a precise budget using actual figures or highly educated estimates. Pull the tax records for the exact property tax bill. Get real quotes from a local insurance agent. And most importantly, set aside specific reserves for future big-ticket items (Capital Expenditures, or CapEx) like a new roof or HVAC system.
A Small Multifamily NOI Example
Let's circle back to our duplex with an EGI of $32,760. Here’s what a sample line-item budget might look like to calculate its NOI:
- Property Taxes: $4,500
- Insurance: $1,800
- Repairs & Maintenance (5% of EGI): $1,638
- Capital Expenditures (5% of EGI): $1,638
- Property Management (8% of EGI): $2,621
- Utilities (Water/Sewer): $1,200
- Landscaping/Snow Removal: $600
Total Operating Expenses = $13,997
Now for the simple math:
$32,760 (EGI) - $13,997 (OpEx) = $18,763 (NOI)
That $18,763 is the annual profit the duplex generates all on its own. It's the foundational number you'll use for just about every other return metric that matters.
Using NOI to Evaluate an Investment
A good starting point for analysis is understanding gross rental yields, which show how much annual rent a property generates relative to its price. For context, as of Q4 2025, the average gross rental yield in the United States hit 6.56%. This means a $300,000 property might be expected to generate around $19,680 in yearly rent before any expenses are paid. You can learn more about global property trends on GlobalPropertyGuide.com.
Once you have a solid Net Operating Income (NOI), you can finally answer the two questions that really matter to any investor: Is this a good investment? And how hard is my cash actually working for me?
This is where we move beyond just seeing if a property makes money and start digging into how well it performs. To do that, we need two critical metrics that tell very different, but equally important, stories about your potential return.
Capitalization Rate: The Apples-to-Apples Comparison
The Capitalization Rate, or Cap Rate, is a foundational metric in real estate. It’s the quickest way to measure a property's unleveraged return—in other words, the rate of return you’d get if you bought the property with all cash, no loan involved.
The formula is super straightforward:
Cap Rate = Net Operating Income (NOI) / Property Purchase Price
Let's plug in the numbers from our duplex example:
$18,763 (NOI) / $300,000 (Purchase Price) = 0.0625, or a 6.25% Cap Rate
This 6.25% figure is incredibly useful. It lets you quickly compare different investment opportunities on a level playing field, no matter how they’re financed. A duplex in Dallas with a 6% cap rate can be directly compared to a fourplex in Miami with a 6% cap rate, helping you get a feel for market values and relative performance. Our guide on how to calculate cap rate dives even deeper into this.
Cash-on-Cash Return: The True Measure of Your Invested Dollar
While cap rate is essential for quick comparisons, most of us use financing to buy property. That’s where Cash-on-Cash Return becomes the star of the show. This metric gets personal—it tells you the return you're earning on the actual cash you pulled out of your pocket to buy the deal.
It measures your annual pre-tax cash flow against the total cash you invested, which includes your down payment, closing costs, and any initial repair funds.
Here's the formula:
Cash-on-Cash Return = Annual Pre-Tax Cash Flow / Total Cash Invested
To get your annual pre-tax cash flow, you just subtract your yearly mortgage payments (often called debt service) from your NOI. Let's say the annual mortgage payment for our duplex is $14,400.
$18,763 (NOI) - $14,400 (Debt Service) = $4,363 (Annual Pre-Tax Cash Flow)
Now, if your total cash to close (a 20% down payment plus closing costs) was $65,000, the math looks like this:
$4,363 / $65,000 = 0.0671, or a 6.7% Cash-on-Cash Return
This metric is everything for investors using leverage. A deal might have a modest 5% cap rate, but with the right financing, it could generate an excellent 10% cash-on-cash return. This is how smart financing can seriously amplify your returns.
Mastering cash-on-cash return is crucial for seeing the real bang-for-your-buck on leveraged deals, which is how most single-family and multifamily investors operate. For instance, a $300,000 property with a 20% down payment ($60,000 cash) and $24,000 in annual rent might have $12,000 in expenses and $9,600 in mortgage payments. That leaves a cash flow of $2,400—a 4% return on the cash invested. To dive deeper into these trends, you can explore more insights about the global property investment outlook on RadarOnline.com.
How to Automate Your Deal Analysis
Let's be direct: manually running the numbers on every single property that crosses your desk is a surefire way to burn out. You'll miss good deals while you're drowning in spreadsheets for bad ones. Seasoned investors know that speed is a massive competitive advantage, and this is where a modern investor marketplace completely changes the game.
Instead of getting bogged down in manual calculations, you can automate the entire front-end analysis.

This lets you focus your precious time and energy on properties that have already passed your initial financial sniff test.
Using Built-in Calculators and Filters
On a platform like ours, most listed properties come with analysis tools baked right in. You can get instant calculations for the most important metrics without ever opening a spreadsheet.
- Pre-calculated Returns: You can immediately see the Cap Rate, projected Cash-on-Cash Return, and monthly cash flow based on the numbers the seller provided. This gives you a quick "go or no-go" signal in seconds.
- Adjustable Inputs: The best tools let you tweak assumptions on the fly. Don't agree with their vacancy rate or management fee? Change it and see how the numbers shift. This makes the analysis truly your own.
Key Takeaway: The goal isn't just about doing the math faster. It's about quickly killing the deals that don't work so you can spend your time underwriting the ones that actually have a shot. Automation lets you analyze ten properties in the time it takes to manually vet one.
For a more granular look, you can use specialized tools like our platform's investment property calculators to run different financing scenarios and stress-test a deal.
Creating Your Smart Buy Box
The real power move with automation is setting up what we call a “Smart Buy Box.” This is simply a set of your specific, non-negotiable criteria that a deal absolutely must meet before it even shows up on your radar.
Think of it as your personal deal-finding robot. On our marketplace, you can set precise parameters in your investor profile like:
- Location: Specific states, counties, or even a handful of zip codes.
- Property Type: Are you only looking for duplexes? Or small multifamily between 5-10 units?
- Return Thresholds: A minimum 7% cap rate or a 10% cash-on-cash return.
Once your buy box is dialed in, the platform becomes your 24/7 scout, sifting through thousands of listings for you. It only brings you the deals that match your exact numbers. This systematic approach flips your deal flow on its head—you go from a reactive, manual chore to a proactive, automated machine, ensuring you spend less time crunching numbers and more time making offers.
Got Questions? We've Got Answers.
Even when you feel like you've got the formulas down, running the numbers on a real deal always brings up new questions. It's just part of the process. Let's tackle some of the most common hurdles investors run into so you can sidestep the costly mistakes.
Is There a Quick Way to Estimate Expenses?
When you’re just starting out and need a quick way to screen a deal, the "50% Rule" is your go-to shortcut. It’s a simple guideline that suggests your total operating expenses (everything besides the mortgage) will eat up about 50% of your gross income.
So, if a property brings in $2,000 a month in rent, this rule estimates your expenses will be around $1,000. It's a fantastic tool for a back-of-the-napkin gut check, but that's all it is—a gut check. It’s not what you use to make a final decision.
For Experienced Investors: The 50% rule is far too blunt for serious analysis. Proper underwriting means building a detailed, line-item budget. You need to pull the actual property tax records, get real insurance quotes from a local agent, and set aside specific reserves. We're talking 5-10% of rent for maintenance and another 5-10% for capital expenditures—those big-ticket items like a new roof or an HVAC system that will eventually fail.
How Should I Factor in Future Rent and Expense Hikes?
A solid rental analysis never stops at year one. The pros create a "pro-forma," which is basically a financial forecast of how the property will perform over the next 5 to 10 years. This is how you really understand if you’ve got a sustainable investment on your hands.
A conservative, realistic pro-forma usually hinges on a few key assumptions:
- Rent Growth: Pencil in a 2-3% annual rent increase. This generally keeps pace with the historical rate of inflation.
- Expense Growth: This is where you need to be a little more cautious. It’s smart to project a slightly higher increase for your expenses, maybe 3-4% annually. Things like insurance, property taxes, and repair costs almost always outpace rental growth.
Forecasting like this stress-tests the deal's future cash flow. It ensures the property isn't just profitable on day one, but can actually stand on its own as your costs inevitably rise faster than your income.
Does My Mortgage Payment Affect Net Operating Income?
No, and this is a critical distinction that trips up a ton of new investors. Your Net Operating Income (NOI) is always calculated before you even think about your debt service (your mortgage payment).
The whole point of NOI is to measure the property’s raw, standalone ability to generate a profit. It has absolutely nothing to do with how you choose to finance it. This is what lets you compare two different properties on an apples-to-apples basis, even if one is bought with all cash and the other is leveraged with a loan.
Your mortgage payment gets subtracted from your NOI to find your final, pre-tax cash flow. The order never changes: EGI minus Operating Expenses gets you to NOI. Then, you subtract your Debt Service from NOI to find your Cash Flow. Getting that sequence right is fundamental to analyzing deals correctly.
Ready to stop drowning in spreadsheets and start finding deals that meet your exact criteria? Set up your free investor profile on our platform to get matched with deals that fit your criteria. Create your free investor profile and let the right deals find you.