
If you're a real estate investor focused on income, you're constantly looking for one simple answer: "How much cash will this deal actually put in my pocket this year?" A cash on cash return calculator gives you exactly that, cutting through the noise to measure your annual profit against the actual cash you put into a deal.
This guide provides a step-by-step framework for using this crucial metric, whether you're a beginner analyzing your first duplex or a seasoned pro scaling a portfolio. We'll show you how to accurately calculate cash on cash return, what defines a "good" return today, and how to avoid common pitfalls that can sink your investment.
Why Cash on Cash Return Is a Critical Investor Metric
Before you even touch a cash on cash return calculator, you need to understand what it really tells you. In a world full of real estate analytics, cash on cash return answers the most fundamental question for any rental investor: “For every dollar of my own cash I invest, how much cash am I getting back annually?”
That simple question is incredibly powerful. It forces you to look past hypothetical appreciation and focus on the real, tangible profitability of an asset.
- For Beginners: It provides immediate feedback on whether a deal is working and generating positive cash flow.
- For Experienced Investors: It's a vital sign for monitoring the health of each property in a portfolio and flagging underperformers that need attention or divestment.
How It Stacks Up Against Other Metrics
Different metrics tell different parts of a deal's story. Knowing what each one does—and doesn't do—is key to a complete analysis.
- Cap Rate (Capitalization Rate): This metric measures a property’s return without leverage, assuming you paid all cash. It’s fantastic for comparing different properties in the same market, but it ignores the impact of financing. You can dive deeper into this in our guide on how to calculate cap rate.
- Return on Investment (ROI): This is a much broader term. It usually measures the total profit over the entire life of the investment, including appreciation when you eventually sell. It's great for judging the overall success of a flip or a long-term hold after the fact, but it tells you nothing about your annual cash flow.
- Internal Rate of Return (IRR): This is an advanced metric that calculates the annualized return over the entire hold period, factoring in the time value of money. It’s a powerful tool for complex projects, but it’s often overkill for a quick, first-year cash flow check.
The cash on cash return formula is a cornerstone of real estate investing for a reason. You divide the annual pre-tax cash flow by the total cash you invested. The key is that "total cash" includes your down payment, all closing costs, initial repair funds, and any financing fees. It’s a true measure of your actual capital at risk.
A Tale of Two Properties
Let's make this real with a simple scenario. Imagine you’re looking at two different deals.
Property A is in a hot, rapidly appreciating neighborhood. But the margins are tight, and it only produces a 3% cash on cash return.
Property B is in a stable, less trendy part of town. It’s not going to make headlines, but it spits out a healthy 10% cash on cash return.
An investor speculating on appreciation might go for Property A. But an investor who needs income and financial stability would see Property B as the clear winner. That strong cash flow acts as a safety net for unexpected repairs and immediately starts generating passive income. This is why understanding your cash on cash return is the bedrock of smart deal analysis—it forces you to define what a "good" deal actually means for you.
How to Accurately Calculate Your Cash on Cash Return
Let’s get our hands dirty and actually run the numbers. A cash on cash return calculator is an incredible tool, but it's only as smart as the inputs you give it. Garbage in, garbage out. To get a number you can trust, we need to break down both sides of the formula—what you earn and what you actually spend.
The formula itself looks simple: Annual Pre-Tax Cash Flow ÷ Total Cash Invested = Cash on Cash Return.
The real work is in nailing down those two inputs. This is where you separate a good-looking deal from a genuinely profitable one by taking an honest, detailed look at the property's potential.
Step 1: Figure Out Your Annual Pre-Tax Cash Flow
Your annual cash flow is the money that actually hits your bank account after all the bills are paid but before you give Uncle Sam his cut. It’s the lifeblood of your rental property.
First, find your Gross Scheduled Income (GSI). This is the total rent you’d collect if the property was occupied 100% of the time for all 12 months.
From there, you must subtract all Operating Expenses (OpEx). This is where most new investors get into trouble. Be brutally realistic here. Your expense list needs to include everything:
- Property Taxes: Pull the most recent tax bill. Be aware that a sale often triggers a reassessment, so that number could jump.
- Property Insurance: Get a real quote from an insurance agent for a landlord policy. Sticker shock here can kill a deal's cash flow.
- Vacancy: No property stays rented 100% of the time. A conservative estimate of 5% to 8% of GSI is standard practice.
- Repairs & Maintenance: This covers the small stuff—a leaky faucet, a broken doorknob. Budgeting 5-10% of gross rent is a safe starting point.
- Capital Expenditures (CapEx): This is a separate bucket for big-ticket replacements like a new roof or HVAC system. Ignoring CapEx is a recipe for disaster. Set aside another 5-10% of gross rent for these future costs.
- Property Management: Even if you plan to self-manage, account for this cost, typically 8-12% of collected rent. Including it keeps your analysis honest and comparable.
- Other Costs: Don't forget utilities (if any are landlord-paid), HOA fees, landscaping, or pest control.
Once you subtract your total operating expenses from your GSI, you have your Net Operating Income (NOI). To find your pre-tax cash flow, you still need to subtract your annual debt service—the total principal and interest you’ll pay on your mortgage for the year.
Step 2: Nail Down Your Total Cash Invested
This is the other side of the equation. Your Total Cash Invested is every single dollar you had to bring to the table to close the deal. It’s much more than just your down payment.
Pro Tip for Beginners: The most common mistake is only counting the down payment. Your actual cash-in is always higher. To get an accurate cash on cash return, you must track every out-of-pocket dollar it took to close the deal and make the property rent-ready.
Your Total Cash Invested must include:
- Down Payment: The chunk of equity you put down to secure your loan.
- Closing Costs: These usually run 2-5% of the purchase price and cover appraisal fees, loan origination fees, title insurance, and attorney costs.
- Inspection Fees: The money you paid professionals to check the property for hidden problems.
- Initial Repairs & Rehab: Any cash you spend right after closing to get the place ready for a tenant—think new paint, fresh carpet, or appliance repairs.
Let’s see how this works with a real-world example.
Single-Family Rental Example: Imagine you’re buying a single-family rental for $250,000. You put 20% down ($50,000).
- Closing Costs & Fees: $8,000
- Initial Repairs (new paint, carpet): $4,000
- Total Cash Invested: $50,000 + $8,000 + $4,000 = $62,000
Now let's look at the cash flow. The property rents for $2,200/month ($26,400/year).
- Total Annual OpEx (taxes, insurance, vacancy, maintenance, etc.): $9,400
- Annual Debt Service (mortgage payments): $12,000
- Annual Pre-Tax Cash Flow: $26,400 - $9,400 - $12,000 = $5,000
Finally, we run the calculation: $5,000 (Cash Flow) ÷ $62,000 (Cash Invested) = 8.06%
Your true cash on cash return is 8.06%. By meticulously tracking every dollar in and out, you get a real picture of how your money is performing.
How to Use the Calculator for Different Investment Strategies
A good cash on cash return calculator isn't just for one type of deal. It’s a versatile tool that helps you stress-test different investment strategies. The core formula stays the same, but what it tells you about a fix-and-flip, a small multifamily, or a classic single-family rental can be wildly different.
By running the numbers on various deals, you get a real sense of how your strategy directly impacts your bottom line. You start to see which levers—like a big rehab budget versus slightly higher rents—really move the needle on your cash flow.
The Classic Single-Family Rental
This is the bread and butter for many investors. The game plan is simple: buy a solid property in a decent area and collect steady monthly rent. The analysis here is straightforward, focusing on predictable income and expenses.
Let’s run the numbers on a typical rental:
- Purchase Price: $300,000
- Down Payment (20%): $60,000
- Closing Costs & Initial Repairs: $12,000
- Total Cash Invested: $72,000
- Annual Gross Rent: $30,000 ($2,500/month)
- Annual Operating Expenses (35%): $10,500
- Annual Debt Service: $14,400
- Annual Pre-Tax Cash Flow: $30,000 - $10,500 - $14,400 = $5,100
Plug that into the formula, and you get: $5,100 ÷ $72,000 = 7.08% Cash on Cash Return. For many buy-and-hold investors, a return in the 7-8% range is considered a solid, achievable target for a stable asset.
The Small Multifamily Property
Now, let's see what happens with a duplex. Multifamily properties can introduce economies of scale. You have multiple income streams under one roof, which provides a buffer if one unit goes vacant. Plus, big-ticket expenses like the roof or insurance are often more efficient on a per-unit basis.
Here's a sample pro-forma for a duplex:
- Purchase Price: $500,000
- Down Payment (25%): $125,000
- Closing Costs & Initial Repairs: $20,000
- Total Cash Invested: $145,000
- Annual Gross Rent (2 units x $2,000/mo): $48,000
- Annual Operating Expenses (40%): $19,200
- Annual Debt Service: $22,500
- Annual Pre-Tax Cash Flow: $48,000 - $19,200 - $22,500 = $6,300
The calculation here is: $6,300 ÷ $145,000 = 4.34% Cash on Cash Return. A lower return is common with small multifamily in competitive markets where purchase prices are high. The trade-off is often better long-term stability and greater appreciation potential.
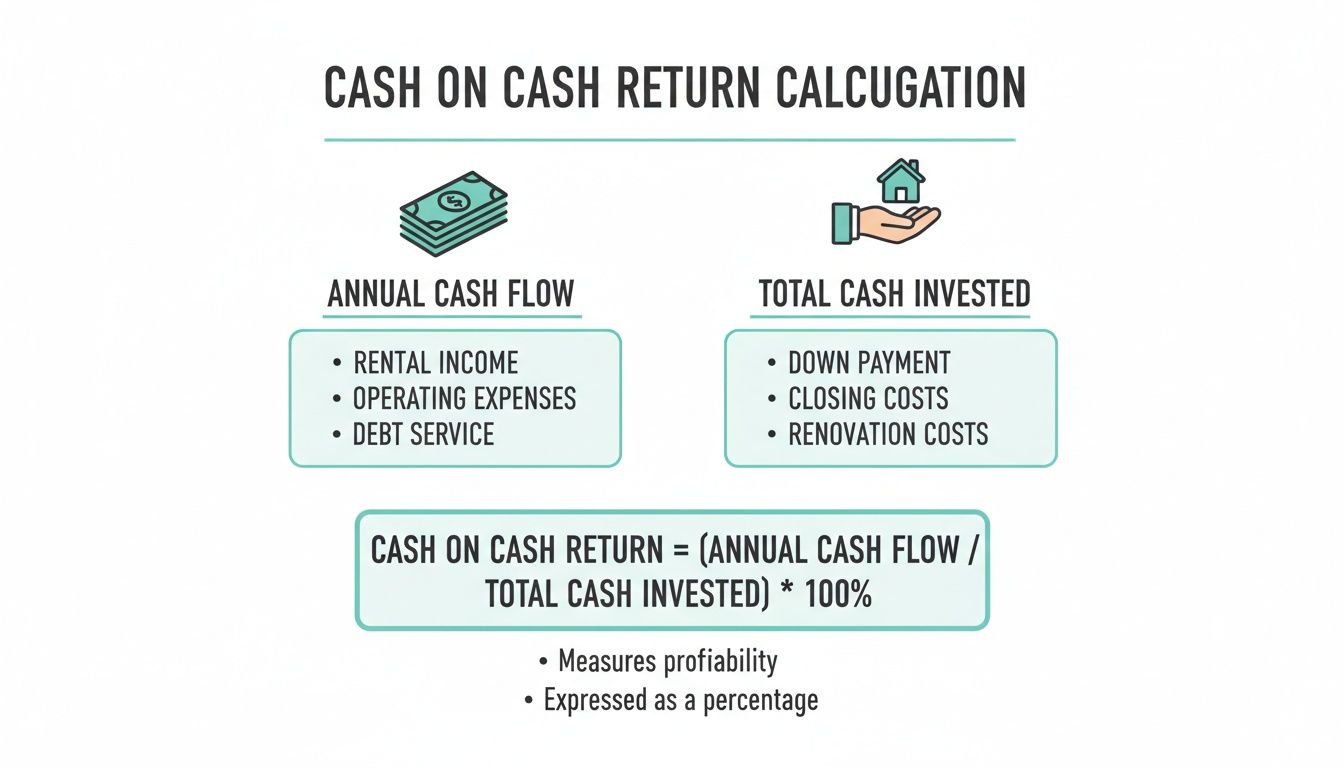
It's a great visual reminder that your return is just as dependent on your initial investment as it is on the property's performance. You have to track both meticulously.
The BRRRR Method Project
The BRRRR (Buy, Rehab, Rent, Refinance, Repeat) strategy is a different beast entirely. It's a value-add play where the goal is to force appreciation, pull your initial cash back out with a refinance, and ideally end up with an "infinite" return.
Let's see how the numbers shift:
- Purchase Price: $200,000
- Down Payment (25%): $50,000
- Closing Costs: $8,000
- Rehab Budget: $40,000
- Total Cash Invested (Initially): $50,000 + $8,000 + $40,000 = $98,000
- Post-Rehab Rent: $2,800/month ($33,600/year)
- Annual Operating Expenses: $11,760
- Annual Debt Service (on initial loan): $9,000
- Annual Pre-Tax Cash Flow (Year 1): $33,600 - $11,760 - $9,000 = $12,840
Before the refinance, your initial cash on cash return is already looking strong: $12,840 ÷ $98,000 = 13.1%.
For Experienced Investors: The real magic of BRRRR happens at the refinance. If the property appraises for $320,000 after your rehab and you get a new loan at 75% LTV, that's a new loan for $240,000. You use that to pay off your original $150,000 loan and get back your entire $98,000 in cash. Now you own a cash-flowing asset with zero money left in the deal.
Financing is the engine that drives every one of these strategies. To see how different loan products can dramatically change your numbers, take a look at our complete guide on real estate financing options.
Using a cash on cash return calculator to model these scenarios before you make an offer is one of the most powerful forms of due diligence you can do.
What's a Good Cash on Cash Return in Today's Market?
You've run the numbers, and your calculator spits out 7%. Is that a home run or a waste of capital? Figuring out the number is just the first step; the real skill is knowing what that number means in today's market.
A "good" return isn't a universal number set in stone. It's a moving target, heavily influenced by interest rates, property type, and location. Just a few years ago, investors might have jumped on a 5% return in a hot market, counting on appreciation. That's not the world we live in anymore.
What Is a Good Return Today?
So, what should you really be aiming for? The goalposts have definitely moved.
For most residential rental properties, a good cash on cash return now lands somewhere between 8% and 12%. While recent data shows the national average hovering around 7.2%, many seasoned investors won't consider a deal under 8%. Why take on the risks of being a landlord when a high-yield savings account offers a competitive return with zero effort?
You can dive deeper into these benchmarks and see how returns are trending in Jaken Finance Group's 2026 statistical report.
A deal's return must be weighed against its risk and your goals. A stable, lower-return asset in a great neighborhood might be the perfect fit for a conservative portfolio. An investor chasing higher growth will need to target riskier deals with the potential for double-digit returns.
How Location and Property Type Shift the Benchmarks
That 8-12% range is a solid starting point, but you must adjust your expectations based on the specific deal. Different strategies and markets come with different risk profiles—and therefore, different return targets.
- Primary Markets (e.g., New York, San Francisco): In these high-cost, high-demand cities, appreciation is often the main event. Cash flow gets squeezed, so investors might accept a lower cash on cash return (4-6%) for what they see as a safer long-term bet.
- Secondary & Tertiary Markets (e.g., Indianapolis, Kansas City): This is often the sweet spot for investors focused on cash flow. Entry points are more affordable, making a target of 8-12% both realistic and common.
- Short-Term Rentals (STRs): Vacation rentals can be cash flow machines but come with more hands-on management and regulatory risk. Because of that extra work, investors demand a premium, often targeting 14% or higher.
- Value-Add & BRRRR Projects: If your plan involves a major renovation, your expected return needs to be much higher to justify the risk and effort. A target of 15% or more on your initial cash (before refinance) is a common benchmark for these projects.
Ultimately, using a cash on cash return calculator isn’t just about getting a number. It’s about using that number to quickly filter out deals that don't match your goals so you can pour all your energy into the right opportunities.
Common Pitfalls in Your Cash on Cash Calculation
A calculator is only as smart as the numbers you feed it. The classic saying holds true: garbage in, garbage out. Even the best cash on cash return calculator will give you dangerously misleading results if you’re plugging in fantasy numbers. The gap between a paper profit and cash in your bank account often comes down to avoiding a few rookie mistakes.
Underestimating Maintenance and Repairs
One of the quickest ways to blow up your projections is by using a lazy, blanket percentage for maintenance. A 30-year-old property will need more TLC than one built five years ago. Maintenance never happens on a predictable schedule; you might go months with nothing, then get hit with a $1,500 plumbing emergency.
- If you’re new: Call local property managers. Ask what they budget for repairs on homes like the one you're analyzing. Their real-world data is gold.
- If you’re experienced: Stop guessing. Pull your own data. What was your actual maintenance spend per door over the last 24 months? Use that number.
Ignoring Capital Expenditures (CapEx)
Maintenance is for small stuff. Capital Expenditures (CapEx) are for the big-ticket items that are not a matter of if, but when: the roof, HVAC, water heater, and windows. These expenses can sink your returns if you aren't ready for them.
A deal can look fantastic on paper until you’re hit with a surprise $15,000 bill for a new roof you never budgeted for. Building a separate CapEx reserve from day one—typically 5-10% of gross rents—is non-negotiable for long-term success.
Forgetting About Vacancy
I've yet to see a property that stays occupied 100% of the time, year after year. Tenants move out, and every day a unit sits empty costs you money. A conservative vacancy factor of 5% to 8% of your Gross Scheduled Income is a solid starting point. Check local market reports for average vacancy rates in that specific submarket to refine your estimate.
Relying on Inflated Rent Estimates
Never trust the "pro-forma rents" on a marketing flyer without verifying them yourself. A seller might claim a unit could rent for $2,000, but if every other comparable unit on the block is getting $1,750, that’s the number you must use. The market decides the rent, not wishful thinking. Use tools like Zillow or Rentometer, or talk to a local property manager to find what tenants are truly paying right now.
Stop Drowning in Spreadsheets: The Power of an Integrated Calculator

We’ve all been there: hunched over a laptop, plugging numbers into a clunky spreadsheet. One tiny formula error and you might chase a dud deal or, worse, pass on a home run. In a fast-moving market, that manual grind doesn't cut it.
This is where a real estate marketplace with built-in tools changes your workflow. By embedding a cash on cash return calculator right into property listings, the painful process of underwriting a deal gets cut from minutes to seconds. You can analyze deals on the spot without ever toggling screens.
Run Your Numbers in Real-Time
The real magic of an integrated calculator is how fast you can stress-test a deal on the fly, getting instant feedback on how different assumptions will play out. In just a few clicks, you can see exactly how a deal performs based on your specific strategy.
- Tweak Your Financing: How does your return look with 20% down versus 25% down?
- Model Different Rates: What happens to your bottom line if rates jump from 6.5% to 7.0%?
- Test Your Rent Projections: See the difference between your conservative rent estimate and an optimistic one.
This immediate feedback loop lets you make decisions with a speed and confidence a spreadsheet can't match. You can explore the different investment property calculators we have built into our platform to see these tools in action.
The most valuable resource for an investor is time. Tools that let you analyze more deals more accurately in less time provide a significant competitive advantage. It's about working smarter, not harder.
From Analysis to Action
Here’s the best part: a good platform doesn't just stop at analysis. It connects your numbers directly to acquisition. You’re not just crunching numbers in a vacuum—you’re taking immediate, informed action.
On our marketplace, for example, wholesalers can upload deals and reach pre-qualified investors. As an investor, you can create a free profile and set up your "buy box." This is where you tell the platform exactly what you’re looking for, right down to the minimum cash on cash return you'll accept.
From that point on, the system does the heavy lifting, surfacing deals that already meet your financial criteria. This flips your entire acquisition process on its head. You go from reactively hunting for deals to having a proactive, almost automated system, letting you focus your energy where it actually counts—on closing great deals.
Got Questions? We’ve Got Answers.
When you start getting serious about rental property investing, a few key questions always pop up. Here are some quick, no-nonsense answers to help you use the cash on cash return calculator like a pro.
What’s the Difference Between Cash on Cash Return and ROI?
The biggest difference is the timeline. Think of it this way: cash on cash return is a snapshot. It’s laser-focused on how your deal is performing right now, this year, based on the actual cash you pulled out of your pocket.
Return on Investment (ROI) is the big picture. It looks at the total profit you made over the entire time you owned the property, all the way through to the sale. It includes your profit from appreciation, which you don’t actually see until you sell. Cash on cash tells you how hard your money is working for you today; ROI tells you how the whole investment played out in the end.
Should I Use a Money-Weighted or Time-Weighted Return?
For individual real estate investors, the money-weighted return is what matters most. Your cash on cash return is a type of money-weighted return, and it's useful because it accounts for the timing and size of your specific cash flows. It reflects your decisions.
A time-weighted return is what fund managers use. It strips out the impact of your personal cash choices to measure the raw performance of an asset. But you’re not a fund manager—you control when you buy, how you finance it, and when you sell. The money-weighted method gives you the real, unvarnished truth about your personal returns.
How Do Taxes Affect My Cash on Cash Calculation?
Cash on cash return is always calculated before taxes. The formula itself doesn't change based on tax law. You use it to judge the raw, fundamental performance of the property itself.
However, taxes absolutely impact your final, take-home profit. Things like depreciation and mortgage interest deductions can make a good deal great. My advice: always run your cash on cash numbers first to see if the deal stands on its own. Then, talk to a sharp tax professional to see how it will all shake out after Uncle Sam gets his cut. It’s a two-step process.
Ready to stop guessing and start analyzing deals with confidence? Create your free investor profile to get matched with deals that fit your criteria.